
Confused? Check out the glossary here.
1. Cruise control
Your defense is obliterated by injury, your offense regresses a hair, and you win nine games. That's a pretty good sign that you've reached your chosen destination.
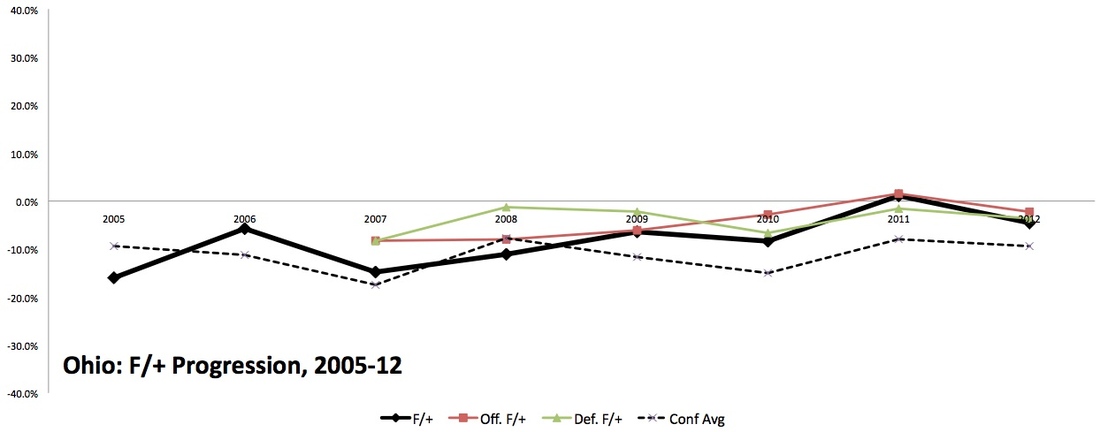
Frank Solich arrived in Athens, Ohio, for the 2005 season; his predecessor, Brian Knorr, had gone just 11-35 in four years at Ohio, and Knorr's predecessor, Jim Grobe, earned a promotion to the Wake Forest job simply by putting together two winning seasons in six years. This was in no way a destination program, even by MAC terms. But in his second season, Solich won nine games. And after a minor setback (10-14 in Year 3-4), he has reached his cruising speed. After winning more than five games in a season just twice in a 23-year span, Ohio has only lost five or fewer games for four straight years.
The Bobcats have yet to pull off a conference title -- and while they will probably be considered this year's East Division favorites, they should expect a fierce challenge from Bowling Green, among others (Kent State, Buffalo) -- but this has become, alongside Northern Illinois and Toledo, one of the steadiest programs in a conference known for parity and quick ups and downs.
2. Boring is good
A year ago, Toledo hired Matt Campbell at 32. New Western Michigan coach P.J. Fleck is just 32 now. Dan Enos was just 41 when Central Michigan hired him three years ago (and he still doesn't look a day over 35). New Northern Illinois coach Rod Carey is just 41 now. Pete Lembo is entering his third year at Ball State at 42. New Kent State coach Paul Haynes is a ripe, old 43.
And then there's Frank Solich. The former Nebraska head coach was 60 when he started his first season at Ohio, and he's only gotten older. (That tends to happen.) While much of the MAC is aiming for the Next Big Thing, Ohio was a little boring in hiring a coaching lifer. It has paid off.
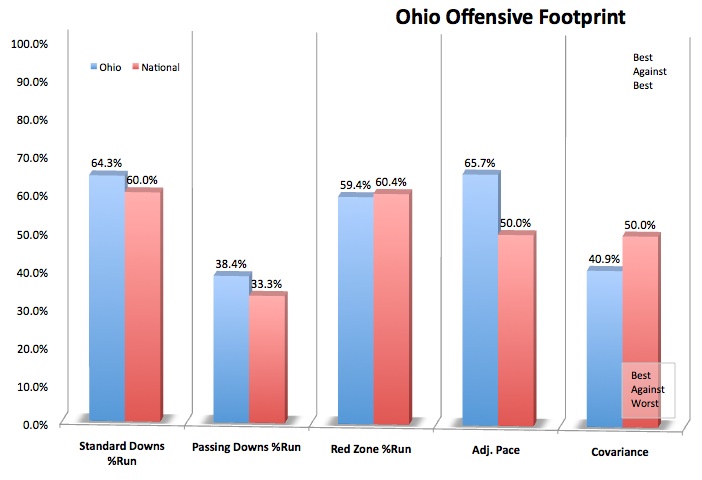
While Solich did move from the I-formation to more spread-friendly principles over the years, his team's style of play has never been particularly MACtion-worthy. Ohio's 10-win 2011 team averaged 31 points per game (just over the national average) and allowed just 22. In 2010, Ohio won eight games with an average score of just 27 to 24. Ohio runs a lot, passes when it has to, leans on special teams when it can, and when it has the health to do so, attempts to choke the life out of a high-octane passing attack. It is a good recipe. There is nothing flashy, but that's okay.
Last year, when things got less boring, when Ohio's defenders started dropping like flies and the squad got involved in more MACtion-style shootouts (37-34, 38-31, 52-27), the results were not particularly kind to the Bobcats. A return to boring could mean very good things for Ohio in 2013.
2012 Schedule & Results
| Record: 9-4 | Adj. Record: 4-9 | Final F/+ Rk: 68 | |||||
| Date | Opponent | Score | W-L | Adj. Score | Adj. W-L |
| 1-Sep | at Penn State | 24-14 | W | 36.8 - 25.7 | W |
| 8-Sep | New Mexico State | 51-24 | W | 30.8 - 19.8 | W |
| 15-Sep | at Marshall | 27-24 | W | 18.9 - 24.5 | L |
| 22-Sep | Norfolk State | 44-10 | W | 18.5 - 25.5 | L |
| 29-Sep | at Massachusetts | 37-34 | W | 26.8 - 49.2 | L |
| 6-Oct | Buffalo | 38-31 | W | 27.3 - 33.1 | L |
| 13-Oct | Akron | 34-28 | W | 26.7 - 28.8 | L |
| 27-Oct | at Miami (Ohio) | 20-23 | L | 21.9 - 31.2 | L |
| 1-Nov | Eastern Michigan | 45-14 | W | 34.0 - 21.0 | W |
| 7-Nov | Bowling Green | 14-26 | L | 19.8 - 26.6 | L |
| 14-Nov | at Ball State | 27-52 | L | 25.0 - 49.3 | L |
| 23-Nov | at Kent State | 6-28 | L | 15.6 - 27.6 | L |
| 28-Dec | vs. UL-Monroe | 45-14 | W | 45.4 - 18.6 | W |
| Category | Offense | Rk | Defense | Rk |
| Points Per Game | 31.7 | 42 | 24.8 | 47 |
| Adj. Points Per Game | 26.7 | 77 | 29.3 | 74 |
3. Attrition took its toll
Their projected starting cornerbacks played a combined one game -- eight plays -- in 2012. Their best defensive end was lost after four games. Their offensive line saw some attrition. Their quarterback got hurt. One of two primary running backs was barely healthy. Their leading receiver missed some time. It was a war of attrition for Ohio last fall, and it was ill-timed. After a season-opening win at Penn State, it wasn't difficult to scope out a potential BCS run for the Bobcats; the schedule was pillow-soft, and the overall level of talent and experience (when healthy) was as strong as any in the MAC. But as the year unfolded, Ohio just couldn't maintain its form.
Adj. Points Per Game (first 4 games): Ohio 26.3, Opponent 23.9 (plus-2.4)
Adj. Points Per Game (next 4 games): Opponent 35.6, Ohio 25.7 (minus-9.9)
Adj. Points Per Game (next 4 games): Opponent 31.1, Ohio 23.6 (minus-7.5)
Adj. Points, Bowl Game: Ohio 45.4, Opponent 18.6 (plus-26.8)
Ohio was at its worst in the middle third of the season. The wins kept rolling in, but the warning signs were there. The Bobcats were barely able to hold off the MAC's two worst teams (UMass and Akron), and though they got to 7-0 before falling, it was obvious they would fall soon. The end of the winning streak came at Miami, and after a rebound against Eastern Michigan, the losses continued. A smoking hot Bowling Green team knocked them off in Athens, then two of the MACs better teams, Ball State and Kent State, dominated them.
Here's where bowl games can produce a lovely shot in the arm. Ohio healed up a bit during the bowl break, laid a whipping on UL-Monroe in the Independence Bowl, and headed into the offseason with spirits a little higher than they could have been.
Last year's injuries are still taking their toll, as well:
Unfortunately for Ohio, a lot of front-line players won’t be ready to go at all this spring. More than a dozen potential starters sat out the first spring practice, and most aren’t exepcted to take part during the next five weeks.
Included in the list of the injured, or recovering from surgery, are WRs Donte Foster, Mario Dovell and Landon Smith, TE’s Tyler Knight and Derek Roback, RB Ryan Boykin, OLs Sam Johnson, John Prior, Jon Lechner and Ryan McGrath, DE Nic Barber and S Josh Kristoff.
That said, the Bobcats still have five and a half months to get healthy for the season. If they do so, they should be a major player in the MAC race.
Offense
| Category | Yards/ Game Rk | S&P+ Rk | Success Rt. Rk | PPP+ Rk |
| OVERALL | 33 | 94 | 109 | 88 |
| RUSHING | 27 | 104 | 113 | 96 |
| PASSING | 53 | 73 | 83 | 64 |
| Standard Downs | 85 | 106 | 70 | |
| Passing Downs | 102 | 95 | 102 | |
| Redzone | 118 | 112 | 121 |
| Q1 Rk | 73 | 1st Down Rk | 95 |
| Q2 Rk | 107 | 2nd Down Rk | 110 |
| Q3 Rk | 89 | 3rd Down Rk | 71 |
| Q4 Rk | 117 |
Quarterback
Note: players in bold below are 2013 returnees. Players in italics are questionable with injury/suspension.
| Player | Ht, Wt | 2013 Year | Rivals | Comp | Att | Yards | Comp Rate | TD | INT | Sacks | Sack Rate | Yards/ Att. |
| Tyler Tettleton | 6'0, 200 | Sr. | ** (5.3) | 228 | 367 | 2,844 | 62.1% | 18 | 4 | 26 | 6.6% | 6.7 |
| Derrius Vick | 6'1, 205 | So. | ** (5.4) | 19 | 30 | 249 | 63.3% | 4 | 1 | 1 | 3.2% | 8.0 |
| Greg Windham | 6'1, 217 | RSFr. | ** (5.4) |
4. Ohio is set at quarterback, probably for a while
It only feels like Tyler Tettleton and Beau Blankenship have been sharing the Ohio backfield for a decade now. Tettleton struggled with an "undisclosed abdomen injury" for much of the middle of the season, limiting his dual-threat effectiveness, but he still racked up 2,800 passing yards, a 62-percent completion rate, an 18-to-4 TD-to-INT ratio, and nearly 500 pre-sack rushing yards. That's impressive considering he missed Ohio's worst opponent (Norfolk State) and only completed 52 percent against three pretty bad teams: UMass, Buffalo and Akron.
When healthy, Tettleton is a dynamo. But when Tettleton was hobbled, backup Derrius Vick showed some solid potential. In his only start of the year against Norfolk State, he completed 14 of 20 passes for 199 yards and four touchdowns. He completed five of 10 passes for 50 yards otherwise, and he showed reasonably decent running ability. With another year as Tettleton's understudy, he could be ready to do some pretty interesting things in 2014.
Running Back
| Player | Pos. | Ht, Wt | 2013 Year | Rivals | Rushes | Yards | Yards/ Carry | Hlt Yds/ Carry | TD | Adj. POE |
| Beau Blankenship | RB | 5'9, 202 | Sr. | *** (5.5) | 312 | 1,604 | 5.1 | 4.9 | 15 | -4.2 |
| Tyler Tettleton | QB | 6'0, 200 | Sr. | ** (5.3) | 94 | 455 | 4.8 | 4.0 | 4 | -2.4 |
| Ryan Boykin | RB | 6'1, 221 | Sr. | ** (4.9) | 74 | 445 | 6.0 | 5.8 | 4 | +4.8 |
| Daz'mond Patterson | RB | 5'6, 178 | So. | ** (5.3) | 34 | 195 | 5.7 | 4.2 | 1 | +0.8 |
| Kyle Hammonds | RB | 5'8, 180 | So. | ** (5.4) | 16 | 115 | 7.2 | 13.2 | 0 | +2.7 |
| Derrius Vick | QB | 6'1, 205 | So. | ** (5.4) | 16 | 77 | 4.8 | 3.2 | 0 | -1.6 |
| Brian Palermo | RB | 5'8, 218 | So. | NR | 7 | 31 | 4.4 | 2.6 | 0 | -1.3 |
5. Interchangeable parts
Beau Blankenship was Ohio's steadiest player in 2012. And by "steady," I mean he was just about the only primary difference-maker who didn't miss time to injury. He leads an interesting set of running backs in 2013; Blankenship (medium), Ryan Boykin (large), and Daz'mond Patterson (small) are built quite different, but they produced remarkably similar numbers last fall: they each averaged between 5.1 and 6.0 yards per carry, and they each averaged between 4.2 and 5.8 highlight yards (the yards after the line has done its job). Boykin showed the most potential of the bunch but couldn't stay on the field, and Patterson is already expected to miss part of this coming season. But if Blankenship does get hurt this year, depending on when it happens, Ohio could remain in good shape in the backfield.
It could be the same story at receiver, where Donte Foster, Chase Cochran, Matt Waters, and Landon Smith are all of similar size and per-target production levels.
Receiving Corps
| Player | Pos. | Ht, Wt | 2013 Year | Rivals | Targets | Catches | Yards | Catch Rate | Yds/ Target | Target Rate | %SD | Real Yds/ Target | RYPR |
| Donte Foster | WR-X | 6'1, 193 | Sr. | NR | 83 | 59 | 659 | 71.1% | 7.9 | 22.0% | 57.8% | 8.0 | 72.3 |
| Bakari Bussey | WR-X | 48 | 37 | 313 | 77.1% | 6.5 | 12.7% | 47.9% | 6.2 | 34.3 | |||
| Tyler Futrell | WR-F | 44 | 28 | 422 | 63.6% | 9.6 | 11.7% | 52.3% | 10.1 | 46.3 | |||
| Chase Cochran | WR-Z | 6'2, 182 | Jr. | ** (5.3) | 35 | 22 | 377 | 62.9% | 10.8 | 9.3% | 68.6% | 10.9 | 41.4 |
| Beau Blankenship | RB | 5'9, 202 | Sr. | *** (5.5) | 30 | 21 | 182 | 70.0% | 6.1 | 8.0% | 56.7% | 6.1 | 20.0 |
| Ryan Clark | WR-Z | 28 | 17 | 174 | 60.7% | 6.2 | 7.4% | 60.7% | 6.2 | 19.1 | |||
| Troy Hill | TE | 6'5, 210 | Sr. | ** (4.9) | 25 | 14 | 169 | 56.0% | 6.8 | 6.6% | 72.0% | 6.8 | 18.5 |
| Matt Waters | WR-F | 6'0, 203 | Sr. | ** (5.4) | 20 | 14 | 225 | 70.0% | 11.3 | 5.3% | 45.0% | 9.8 | 24.7 |
| Jordan Thompson | TE | 17 | 8 | 95 | 47.1% | 5.6 | 4.5% | 35.3% | 4.8 | 10.4 | |||
| Landon Smith | WR | 5'11, 180 | Jr. | ** (5.4) | 14 | 8 | 198 | 57.1% | 14.1 | 3.7% | 35.7% | 15.9 | 21.7 |
| Derek Roback | TE | 6'3, 249 | So. | *** (5.5) | 11 | 7 | 123 | 63.6% | 11.2 | 2.9% | 45.5% | 12.9 | 13.5 |
| John Tanner | TE | 6'4, 240 | RSFr. | ** (5.4) | |||||||||
| Mason Morgan | TE | 6'7, 230 | Fr. | ** (5.4) | |||||||||
| Casey Sayles | TE | 6'4, 260 | Fr. | ** (5.4) | |||||||||
| James Alexander | WR | 6'1, 185 | Fr. | ** (5.4) | |||||||||
| Justin Wyatt | WR | 6'2, 190 | Fr. | ** (5.4) |
Offensive Line
| Category | Adj. Line Yds | Std. Downs LY/carry | Pass. Downs LY/carry | Opp. Rate | Power Success Rate | Stuff Rate | Adj. Sack Rate | Std. Downs Sack Rt. | Pass. Downs Sack Rt. |
| Team | 95.7 | 3.04 | 2.89 | 39.4% | 75.6% | 15.8% | 81.0 | 6.4% | 6.0% |
| Rank | 86 | 51 | 89 | 61 | 23 | 15 | 89 | 92 | 50 |
| Player | Pos. | Ht, Wt | 2013 Year | Rivals | Career Starts/Honors/Notes |
| Eric Herman | RG | 51 career starts; 2012 2nd All-MAC | |||
| Skyler Allen | C | 39 career starts; 2012 2nd All-MAC | |||
| Jon Lechner | LG | 6'5, 332 | Sr. | *** (5.7) | 27 career starts |
| Ryan McGrath | RT | 6'6, 304 | Sr. | NR | 16 career starts |
| Vince Carlotta | LG | 15 career starts | |||
| John Prior | LT | 6'6, 301 | Sr. | *** (5.6) | 13 career starts |
| Bryce Dietz | RT | 6'5, 290 | So. | ** (5.3) | 1 career start |
| J.D. Bales | LG | 1 career start | |||
| Lucas Powell | C | 6'3, 284 | So. | *** (5.5) | |
| Mike Lucas | RG | 6'4, 340 | So. | ** (5.3) | |
| Mike McQueen | RT | 6'5, 305 | So. | ** (5.4) | |
| Nick Gibbons | OL | 6'4, 308 | RSFr. | *** (5.5) | |
| Zachary Murdock | OL | 6'4, 285 | Fr. | *** (5.5) |
6. Can the line avoid mistakes again?
Ohio's overall rushing efficiency was pretty awful in 2012 -- the Bobcats ranked 113th in Rushing Success Rate+ -- but their ability to avoid setbacks and keep moving forward, however slightly, paid off at times. If they could just get to third-and-short, the line would deliver the yards necessary to move the chains. The line's stuff rate (the avoidance of tackles-for-loss on the ground) and power success rate (the ability to convert in short yardage situations) were both strong, even if its down-to-down proficiency was perhaps lacking. But in 2013, it will be without its two steadiest, best performers, guard Eric Herman and center Skyler Allen.
Solich has stockpiled some interesting prospects on the line; two-year starting guard Jon Lechner, one-year starting left tackle John Prior, sophomore center Lucas Powell, freshmen Nick Gibbons (redshirt) and Zachary Murdock (true) were among Ohio's more highly-touted recruits in recent years. It appears there is potential here, but can a less experienced line provide the same level of safety when it comes to avoiding mistakes and converting on third-and-short?
Defense
| Category | Yards/ Game Rk | S&P+ Rk | Success Rt. Rk | PPP+ Rk |
| OVERALL | 56 | 103 | 110 | 97 |
| RUSHING | 60 | 108 | 110 | 98 |
| PASSING | 56 | 98 | 102 | 96 |
| Standard Downs | 102 | 115 | 93 | |
| Passing Downs | 98 | 89 | 99 | |
| Redzone | 91 | 81 | 92 |
| Q1 Rk | 115 | 1st Down Rk | 96 |
| Q2 Rk | 93 | 2nd Down Rk | 84 |
| Q3 Rk | 81 | 3rd Down Rk | 105 |
| Q4 Rk | 91 |
7. Opponents knew they could pass
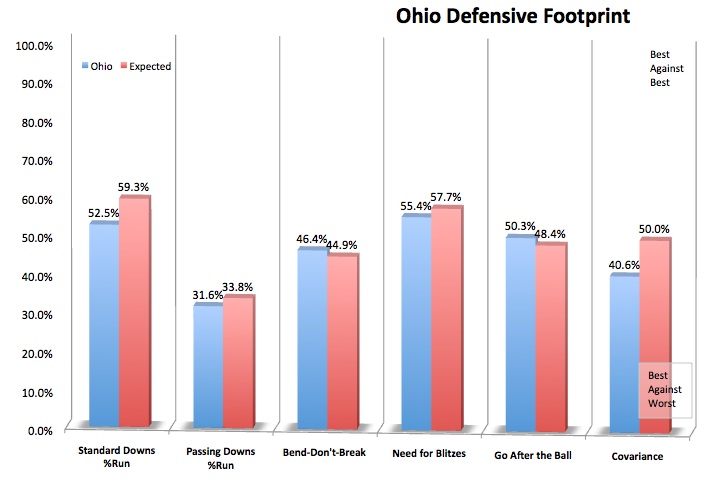
Ohio's defensive front was far from intimidating. The Bobcats ranked just 110th in Rushing Success Rate+ and 108th in Rushing S&P+; that's not good. But while the pass defense ranked slightly better, it is perhaps telling that, even in a conference with plenty of run-heavy teams (like Eastern Michigan), opponents were content to pass all day against Ohio. Opponents ran just 53 percent of the time on standard downs, a sign that they saw some serious mismatches against Ohio's secondary. This makes sense: projected all-conference corner Travis Carrie was lost for the season in fall camp, and starter Jamil Shaw was lost in the first quarter of the first game. Ohio had to do some serious shuffling in the secondary, and with the line's own deficiencies, the Bobcats couldn't lean on much of a pass rush either. Quarterbacks had all day to throw to receivers that probably didn't need long to get open. Bad combination.
I might set a record with the number of times I use "if healthy" in this piece, but ... if healthy, Carrie, Shaw, and the now-experienced Ohio secondary should expect pretty impressive improvement in 2013. Of course, that will only matter so much if the line doesn't improve.
Defensive Line
| Category | Adj. Line Yds | Std. Downs LY/carry | Pass. Downs LY/carry | Opp. Rate | Power Success Rate | Stuff Rate | Adj. Sack Rate | Std. Downs Sack Rt. | Pass. Downs Sack Rt. |
| Team | 87.7 | 3.10 | 3.75 | 42.8% | 75.0% | 19.9% | 67.8 | 3.2% | 4.0% |
| Rank | 114 | 90 | 109 | 108 | 106 | 53 | 108 | 103 | 104 |
| Name | Pos | Ht, Wt | 2013 Year | Rivals | GP | Tackles | % of Team | TFL | Sacks | Int | PBU | FF | FR |
| Carl Jones | DT | 13 | 38.5 | 5.3% | 7.5 | 3 | 0 | 2 | 1 | 0 | |||
| Corey Hasting | DE | 13 | 36.0 | 4.9% | 7 | 1.5 | 0 | 1 | 2 | 0 | |||
| Antwan Crutcher | NG | 6'1, 300 | Jr. | ** (5.4) | 12 | 26.0 | 3.6% | 3 | 1.5 | 0 | 0 | 0 | 0 |
| Neal Huynh | NG | 12 | 19.5 | 2.7% | 8 | 2.5 | 0 | 4 | 0 | 0 | |||
| Ty Branz | DE | 6'2, 250 | Sr. | ** (5.4) | 13 | 16.5 | 2.3% | 4.5 | 3 | 0 | 1 | 1 | 0 |
| Tremayne Scott | DE | 4 | 10.0 | 1.4% | 3.5 | 2 | 1 | 0 | 0 | 1 | |||
| Nic Barber | DE | 6'3, 219 | Sr. | NR | 10 | 9.5 | 1.3% | 2 | 1 | 0 | 0 | 0 | 0 |
| Kendric Smith | DE | 6'3, 245 | Jr. | NR | 12 | 9.0 | 1.2% | 0.5 | 0.5 | 0 | 0 | 0 | 0 |
| Brandon Purdum | DE | 6'3, 255 | So. | ** (5.3) | 9 | 7.0 | 1.0% | 0.5 | 0.5 | 0 | 0 | 0 | 0 |
| Kendrick Davis | DT | 6'3, 280 | Sr. | NR | 10 | 6.5 | 0.9% | 2.5 | 2 | 0 | 0 | 0 | 0 |
| Tony Davis | DE | 6'4, 215 | Jr. | ** (5.4) | 4 | 3.0 | 0.4% | 0 | 0 | 0 | 0 | 0 | 0 |
| Watson Tautuiaki | DT | 6'4, 305 | Jr. | ** (5.3) | |||||||||
| Cameron McLeod | DE | 6'3, 285 | Jr. | ** (5.2) | |||||||||
| Tarell Basham | DE | 6'4, 240 | Fr. | ** (5.4) | |||||||||
| Trent Smart | DE | 6'4, 235 | Fr. | ** (5.4) |
8. Attrition that doesn't count as attrition
Eight members of Ohio's 22-man February recruiting class are defensive linemen. Two are junior college transfers (and Solich doesn't mine the JUCOs that heavily). That's a pretty good sign that everybody involved knows that Ohio's front four needs serious improvement.
It's also a good sign that the attrition up front -- five of Ohio's seven leading tacklers on the line have graduated -- won't mean too much. Granted, tackles Carl Jones and Neal Huynh combined for a pretty impressive (for tackles) 15.5 tackles for loss, and end Tremayne Scott was a strong contributor before injury. But Ohio already got used to playing without Scott, and if newcomers like JUCOs Watson Tautuiaki and Cameron McLeod, along with perhaps one of many freshmen, can mix with returnees Antwan Crutcher and Ty Branz, improvement can be found. It can't get much worse than 114th in Adj. Line Yards and 108th in Adj. Sack Rate.
Linebackers
| Name | Pos | Ht, Wt | 2013 Year | Rivals | GP | Tackles | % of Team | TFL | Sacks | Int | PBU | FF | FR |
| Keith Moore | MLB | 6'0, 219 | Sr. | NR | 13 | 72.0 | 9.8% | 5.5 | 2 | 2 | 2 | 0 | 1 |
| Alphonso Lewis | SLB | 13 | 46.5 | 6.4% | 1.5 | 0.5 | 0 | 2 | 1 | 1 | |||
| Jelani Woseley | WLB | 13 | 44.0 | 6.0% | 7 | 1.5 | 4 | 7 | 0 | 0 | |||
| Ben Russell | MLB | 6'1, 234 | So. | *** (5.5) | 11 | 13.0 | 1.8% | 1 | 0.5 | 0 | 0 | 0 | 0 |
| Brandon Atwell | LB | 6'2, 212 | Jr. | ** (5.2) | 12 | 11.0 | 1.5% | 0.5 | 0 | 0 | 0 | 0 | 0 |
| Tim Edmond | LB | 5'11, 240 | Jr. | *** (5.5) | 13 | 10.0 | 1.4% | 0.5 | 0 | 0 | 0 | 0 | 0 |
| Blake Jones | LB | 6'0, 225 | Jr. | ** (5.1) | 12 | 4.0 | 0.5% | 1 | 1 | 0 | 0 | 0 | 0 |
| Jovon Johnson | LB | 6'0, 215 | So. | ** (5.2) | 11 | 2.5 | 0.3% | 0 | 0 | 0 | 2 | 0 | 0 |
| A.J. Grady | SLB | 6'1, 198 | Jr. | ** (5.4) | 11 | 2.5 | 0.3% | 0 | 0 | 0 | 0 | 0 | 0 |
| Jake Schany | LB | 6'2, 210 | RSFr. | *** (5.5) |
Secondary
| Name | Pos | Ht, Wt | 2013 Year | Rivals | GP | Tackles | % of Team | TFL | Sacks | Int | PBU | FF | FR |
| Josh Kristoff | SS | 6'0, 194 | Jr. | ** (5.2) | 13 | 47.0 | 6.4% | 2.5 | 0 | 0 | 3 | 0 | 1 |
| Larenzo Fisher | CB | 5'11, 170 | Jr. | *** (5.5) | 13 | 45.0 | 6.1% | 0 | 0 | 0 | 8 | 1 | 1 |
| Nate Carpenter | NB | 5'9, 197 | Jr. | ** (5.2) | 13 | 44.5 | 6.1% | 6 | 1 | 2 | 3 | 0 | 2 |
| Travis Carrie (2011) | CB | 5'11, 203 | Sr. | NR | 14 | 42.0 | 5.6% | 1.5 | 0 | 4 | 13 | 0 | 0 |
| Devin Bass | CB | 5'9, 178 | So. | ** (5.2) | 13 | 39.5 | 5.4% | 3 | 0 | 1 | 6 | 0 | 0 |
| Ian Wells | CB | 5'11, 192 | Jr. | ** (5.4) | 13 | 39.0 | 5.3% | 1 | 1 | 0 | 7 | 1 | 1 |
| Gerald Moore | FS | 11 | 35.5 | 4.8% | 2.5 | 0 | 1 | 3 | 1 | 1 | |||
| Thad Ingol | FS | 5'10, 190 | Jr. | ** (5.2) | 11 | 22.5 | 3.1% | 0 | 0 | 1 | 1 | 2 | 0 |
| Jamil Shaw (2011) | CB | 6'0, 208 | Jr. | ** (5.2) | 13 | 16.0 | 2.1% | 1 | 0 | 0 | 3 | 1 | 0 |
| Mose Denton | NB | 13 | 15.5 | 2.1% | 0 | 0 | 0 | 3 | 0 | 0 | |||
| Xavier Hughes | S | 6'1, 171 | Sr. | *** (5.5) | 4 | 12.0 | 1.6% | 2 | 0 | 0 | 1 | 1 | 0 |
| Octavius Leftwich | CB | 12 | 9.0 | 1.2% | 1 | 0 | 1 | 0 | 1 | 1 | |||
| Devin Jones | SS | 6'0, 210 | So. | NR | 11 | 8.0 | 1.1% | 0 | 0 | 0 | 0 | 0 | 0 |
| Blake Scipio | DB | 5'11, 185 | So. | NR | 8 | 3.0 | 0.4% | 0 | 0 | 0 | 0 | 0 | 0 |
| James Ray | S | 6'0, 185 | So. | NR | 6 | 2.5 | 0.3% | 0 | 0 | 0 | 0 | 0 | 0 |
| Aaron Macer | S | 6'0, 194 | So. | ** (5.4) | 8 | 1.5 | 0.2% | 0 | 0 | 0 | 0 | 0 | 0 |
| Sebastian Smith | DB | 6'2, 180 | RSFr. | *** (5.7) | |||||||||
| Corey Quallen | DB | 6'2, 205 | Fr. | ** (5.4) |
9. Extra seasoning
I say it about 60 times per year during the preseason previews: Injuries hurt in the present tense and help in the future tense. Without Travis Carrie and Jamil Shaw, Ohio was forced to dip into its reservoir of corners, instead going with then-sophomores Larenzo Fisher and Ian Wells and then-freshman Devin Bass. The results were less than impressive. But with Carrie (granted a sixth year) and Shaw returning eventually, Ohio will have a much deeper base of experience in 2013 than it expected to have. Throw in safety Josh Kristoff and Nate Carpenter, a particularly intriguing nickel back (six tackles for loss, five passes defensed), and now you've got a reasonably interesting set of defensive backs.
Special Teams
| Punter | Ht, Wt | 2013 Year | Punts | Avg | TB | FC | I20 | FC/I20 Ratio |
| Grant Venham | 6'3, 210 | So. | 55 | 39.5 | 5 | 19 | 24 | 78.2% |
| Kicker | Ht, Wt | 2013 Year | Kickoffs | Avg | TB | TB% |
| Matt Weller | 86 | 62.2 | 33 | 38.4% |
| Place-Kicker | Ht, Wt | 2013 Year | PAT | FG (0-39) | Pct | FG (40+) | Pct |
| Matt Weller | 49-49 | 16-23 | 69.6% | 7-8 | 87.5% |
| Returner | Pos. | Ht, Wt | 2013 Year | Returns | Avg. | TD |
| Daz'mond Patterson | KR | 5'6, 178 | So. | 24 | 24.2 | 1 |
| Kyle Hammonds | KR | 5'8, 180 | So. | 12 | 20.2 | 0 |
| Devin Bass | KR | 5'9, 178 | So. | 6 | 20.2 | 0 |
| Ryan Clark | PR | 25 | 8.1 | 0 |
| Category | Rk |
| Special Teams F/+ | 35 |
| Net Punting | 99 |
| Net Kickoffs | 54 |
| Touchback Pct | 50 |
| Field Goal Pct | 53 |
| Kick Returns Avg | 66 |
| Punt Returns Avg | 50 |
2013 Schedule & Projection Factors
| 2012 Schedule | ||
| Date | Opponent | Proj. Rk |
| 31-Aug | at Louisville | 33 |
| 7-Sep | North Texas | 112 |
| 14-Sep | Marshall | 79 |
| 21-Sep | Austin Peay | NR |
| 5-Oct | at Akron | 120 |
| 12-Oct | Central Michigan | 96 |
| 19-Oct | at Eastern Michigan | 118 |
| 26-Oct | Miami (Ohio) | 106 |
| 5-Nov | at Buffalo | 101 |
| 12-Nov | at Bowling Green | 67 |
| 19-Nov | Kent State | 80 |
| 29-Nov | Massachusetts | 124 |
| Five-Year F/+ Rk | 76 |
| Two-Year Recruiting Rk | 97 |
| TO Margin/Adj. TO Margin* | +15 / +16.6 |
| TO Luck/Game | -0.6 |
| Approx. Ret. Starters (Off. / Def.) | 11 (6, 5) |
| Yds/Pt Margin** | -1.7 |
10. Another monstrous opportunity
Ohio's 2013 schedule takes shape a lot like its 2012 schedule: A big (but winnable) challenge up front, followed by quite a bit of cake. Eventually the challenges will mount -- the three-week stretch of @Buffalo, @BGSU, Kent State is particularly daunting -- but if the Bobcats can pull off another Week 1 upset (and make no mistake: on paper, Louisville is not the Top 10 team they will be in the polls) and stay healthy this time, they could go a long way without a serious challenge.
And even if Ohio does lose to Louisville, the odds of a 7-1 record heading into November are good, as are the odds of another great, boring, nine-win (or better) season in Athens.
Follow @SBNationCFBFollow @SBNRecruiting
More from SB Nation:
• SB Nation reports Sun Belt expansion
• SB Nation’s Garnet & Black Attack interviews Marcus Lattimore
• SB Nation’s Maize n Brew interviews Denard Robinson
• College football's most penalized teams and flag-happy refs
• EDSBS: An Alabama fan confronts the law
• What if March Madness had football ... | ... Or football had Madness