Quantcast
Channel: SBNation.com: All Posts by Bill Connelly
Viewing all 4373 articles
Browse latest View live

Study Hall: Mizzou 89, LSU 76

$
0
0
20130302_jla_ad9_715

Your Trifecta: Oriakhi-Bowers-Pressey. Your winner: switzy227. Must've been all that insight he got during the Boston watch party...

So I didn't get to see one second of this game (other than the highlights, anyway). For this recap, then, I'll do what I've done before and ask some questions for the peanut gallery.

This was an absolutely crazy game to follow on my phone, by the way. Mizzou's up 6-0, down 25-12, and up 41-33, all in the first half? Silliness.

Mizzou 89, LSU 76

Mizzou
LSU
Pace (No. of Possessions)65.4
Points Per Possession (PPP)1.361.16
Points Per Shot (PPS)1.441.23
2-PT FG%67.4%41.2%
3-PT FG%31.3%42.9%
FT%70.6%75.0%
True Shooting %64.0%55.0%
MizzouLSU
Assists1711
Steals35
Turnovers1110
Ball Control Index (BCI)
(Assists + Steals) / TO
1.821.60
MizzouLSU
Expected Offensive Rebounds1013
Offensive Rebounds1314
Difference+3+1

Question No. 1: Did Mizzou's defense stink for most of the game, or did it just really, really stink for seven minutes?

You just can't make it far in March if you're letting South Carolina and LSU take an absurd 54 3-pointers and make 41 percent of them. I know that a lot of the 3's against South Carolina were pretty well-guarded, but ... yuck. Whether you regard 3-point attempts allowed or 3-point percentage allowed as the best way to measure 3-point defense, Mizzou has begun to absolutely stink at this again.

LSU went on a 25-6 run from the 17:39 mark of the first half to the 10:31 mark. LSU's possession in that span: 3-pointer (3 pts), putback (2 pts), missed layup, 3-pointer (3 pts), free throws (1 pt), 3-pointer (3 pts), putback (2 pts), free throws (2 pts), 3-pointer (3 pts), 3-pointer (3 pts), 3-pointer (3 pts). During this run: 2.27 points per possession. Rest of game: 0.93. During this run: 6-for-7 on 3-pointers (86%). Rest of game: 6-for-21 (29%). Were the rest-of-game 3's more well-guarded than the seven during LSU's run, or did the Bayou Bengals just regress toward the mean?

Mizzou's possessions in that span, by the way? Turnover, missed layup, missed 3-pointer, missed 3-pointer, turnover, putback (2 pts), missed jumper, layup (2 pts), layup (2 pts), missed jumper, turnover. During this run: 0.55 points per possession. Rest of game: 1.54 points per possession.

Question No. 2: How much did LSU press?

LSU had won nine of its last 11 games heading into this one and had won four games (all at home, mind you) against Top 100 teams, including Missouri. They had done this while slowing their pace down from about 71 possessions per game to about 68. I was wondering if Johnny Jones was realizing his personnel wasn't quite capable of playing the style he wanted and scaled back the pressing (successfully) to fit the personnel. Since Mizzou won the BCI battle and committed only 11 turnovers at just a 65-possession pace, that either means that LSU didn't press much, or that Mizzou beat the press pretty calmly and easily. I'm assuming the former.

Mizzou Player Stats

(Definitions at the bottom of the post.)

Player
AdjGSGmSc/MinLine
Alex Oriakhi22.70.7331 Min, 18 Pts (9-11 FG, 0-2 FT), 10 Reb (5 Off), 4 Blk, 2 TO, 4 PF
Laurence Bowers21.90.6633 Min, 23 Pts (10-17 FG, 0-3 3PT, 3-3 FT), 10 Reb (4 Off), 2 Ast, 2 TO
Phil Pressey17.70.4936 Min, 15 Pts (5-11 FG, 2-5 3PT, 3-5 FT), 8 Ast, 5 Reb, 2 Stl, 2 TO
Keion Bell13.30.4132 Min, 11 Pts (4-6 FG, 3-3 FT), 6 Reb (3 Off), 3 Ast, 2 TO
Earnest Ross9.90.4124 Min, 13 Pts (4-7 FG, 2-4 3PT, 3-3 FT), 2 TO
Jabari Brown2.00.0826 Min, 4 Pts (2-5 FG, 0-2 3PT, 0-1 FT), 2 Reb, 2 Ast
Negus Webster-Chan1.40.217 Min, 3 Pts (1-2 3PT)
Tony Criswell-0.8-0.0811 Min, 2 Pts (1-3 FG)
PlayerUsage%Floor%Touches/
Poss.
%Pass%Shoot%Fouled%T/O
Oriakhi22%62%2.028%53%10%10%
Bowers31%51%3.035%50%9%6%
Pressey21%47%5.472%17%8%3%
Bell14%54%2.762%21%10%7%
Ross21%46%2.233%39%17%11%
Brown10%42%2.066%28%6%0%
NWC14%45%0.80%100%0%0%
Criswell18%22%1.10%75%0%25%

The point totals of the last two games have been hilarious.

Laurence Bowers: 6 points vs. South Carolina, 23 points vs. LSU (+17)
Phil Pressey: 0 points vs. South Carolina, 15 points vs. LSU (+15)
Keion Bell: 24 points vs. South Carolina, 11 points vs. LSU (-13)
Jabari Brown: 23 points vs. South Carolina, 4 vs. LSU (-19)

The constant, of course? Alex Oriakhi, who scored 18 in each.

In Mizzou's wins versus "real" opponents, the Tigers have five guys pitching in double-digit Adj. GS totals (Oriakhi 17.1, Bowers 14.5, Brown 12.8, Pressey 12.0, Bell 11.8), with a sixth coming really close (Ross 9.8). In losses, the Tigers have just three (Bell 15.8, Pressey 12.6, Oriakhi 11.5). Mizzou has so many weapons; when a few of them show up at the same time, the Tigers win. When they don't, the Tigers don't. Defense is still the biggest issue for this team, but Mizzou has enough weapons to survive its occasionally bad defense for at least a while.

Question No. 3: How did the offense flow?

I know a lot of us are hammering away at the "The offense needs to flow from the inside, out" narrative right now, and I can't necessarily say I disagree. But I noticed that 10 of Oriakhi's points came on five offensive rebounds, meaning that he only scored nine points on 4-for-6 shooting when he wasn't pulling down someone else's miss. And I'm assuming Bowers didn't post up much either; he made two of three putback attempts himself, but considering that he took three 3-pointers, I'm assuming quite a few of his other 14 FG attempts were of longer distances.

At the same time, though, Mizzou only attempted 16 3-pointers, three fewer than their 19.0 average versus "real" opponents, and Bowers and Oriakhi did combine for three assists. So ... what's the story here?

Three Keys Revisited

From Friday's preview.

Limit Turnovers

We cannot turn the ball over against this team. They like to score in transition, and giveaways will allow them to do that. Good Phil along with another solid performance from our guards would go a long way in this one.

Turnovers: Missouri 11, LSU 10
BCI: Mizzou 1.82, LSU 1.60

You'd always prefer single-digit turnovers, but this isn't bad.

Contain Johnny O'Bryant III

What is it with big guys whose last names start with "O" having success against this team? (Too soon?) This man is an absolute beast, almost averaging a double double and putting up about 17 points a game. If Oriakhi can handle him, LSU loses their most valuable piece on offense.

O'Bryant: 36 minutes, 18 points (7-14 FG), 8 rebounds (5 offensive), 0 blocks, 3 turnovers
Oriakhi: 31 minutes, 18 points (9-11 FG), 10 rebounds (5 offensive), 4 blocks, 2 turnovers

O'Bryant did pretty well, but Oriakhi did better.

DEFENSE

An awful defensive showing in the first half against South Carolina kept them in the game, and a pretty great defensive showing in the second half took them right back out of it. Mizzou has proven they can and will score, especially at home. It's time we show some consistency on defense too. Three combined halves of bad defense (and one OT period) against Kentucky and South Carolina vs. three combined halves of good defense against Florida and South Carolina are a good enough sample for me to say that this team will go as far as the defense takes them.

LSU: 1.16 points per possession.

After three games of stellar to great defense, Mizzou has now allowed 1.19, 1.12 and 1.16 points per possession in their last three games. It hasn't hurt them much, at least in the last week, because the Tigers' offense was ridiculous: 1.48 PPP versus South Carolina, 1.36 versus LSU. But it will hurt them soon if it doesn't start to trend back in the other direction.

Summary

Question No. 4: After Mizzou's performance (on both sides of the court) versus an athletic, aggressive team like LSU, are you more or less confident about Mizzou handling Arkansas tomorrow night at Mizzou Arena?

---

AdjGS: a take-off of the Game Score metric (definition here) accepted by a lot of basketball stat nerds. It takes points, assists, rebounds (offensive & defensive), steals, blocks, turnovers and fouls into account to determine an individual's "score" for a given game. The "adjustment" in Adjusted Game Score is simply matching the total game scores to the total points scored in the game, thereby redistributing the game's points scored to those who had the biggest impact on the game itself, instead of just how many balls a player put through a basket.

Usage%: This "estimates the % of team possessions a player consumes while on the floor" (via). The usage of those possessions is determined via a formula using field goal and free throw attempts, offensive rebounds, assists and turnovers. The higher the number, the more prevalent a player is (good or bad) in a team's offensive outcome.

Floor%: Via Basketball-Reference.com: Floor % answers the question, "when Player X uses a possession, what is the probability that his team scores at least 1 point?". The higher the Floor%, the more frequently the team probably scores when the given player is involved.

Touches/Possession: Using field goal attempts, free throw attempts, assists and turnovers, Touches attempt to estimate "the number of times a player touched the ball in an attacking position on the floor." Take the estimated touches and divide it by the estimated number of possessions for which a player was on the court, and you get a rough idea of how many times a player touched the ball in a given possession. For point guards, you'll see the number in the 3-4 range. For shooting guards and wings, 2-3. For an offensively limited center, 1.30. You get the idea.

Anyway, using the Touches figure, we can estimate the percentage of time a player "in an attacking position" passes, shoots, turns the ball over, or gets fouled.


So it appears Bailey Erwin has quit the Mizzou Softball team

$
0
0

She's not on the official roster (linked above), which basically confirms the rumors floated around on other sites (namely PowerMizzou) earlier today. Erwin was in a battle with Nicole Hudson for the role of Chelsea Thomas' Primary Backup, and she wasn't doing tremendously well in that effort so far this year.

I guess that makes Nicole Hudson the official No. 2 pitcher, with perhaps senior Lindsey Muller (who pitched a decent amount in 2011) the stopgap No. 3? Regardless, this is a blow to Mizzou's depth, especially considering all we've heard about Ehren Earleywine wanting to protect Thomas' arm for May. Plus, since Thomas, Hudson and Muller are all seniors, that means Mizzou will be leaning heavily on two stud freshmen -- Maryland's Tori Finucane and Idaho's Casey Stangel -- in 2014.

Rock-M-Tology, 3-4-13

$
0
0
Rock_mtology_big_board

Notes:

  • For this week, I compared my bracket to that of the Bracket Matrix, a wonderful amalgamation of bracketologists' picks. So when you see the "overrated" and "underrated" sections below, know that I'm basing those opinions off of where I disagree with the Matrix.
  • You should probably never disagree with the Matrix.
  • Bracketing the 5-12-4-13 line was particularly weird this time, so I ended up having to do what I hate: potentially pairing two conference mates in the Round of 32. Sorry, Oklahoma State and Iowa State. I don't like it either.
  • And yes, with Kansas now a 1 and Missouri still an 8, I tried to pair them up, but Mizzou would have ended up in Florida's region, which is a no-no. So Mizzou gets Colorado again.
  • The sites for the rounds of 64 and 32 are interesting this year. Michigan and Michigan State could both end up in Auburn Hills, while Lexington could host two teams that aren't liked very much by Kentucky fans: Louisville and Duke.
  • The SEC may not be a great conference, but it is a crazy one. I've been keeping track of my rankings each week since the first Rock-M-Tology three weeks ago. Since February 11, Tennessee has gone from 100th to 59th, Arkansas from 87th to 63rd, and LSU from 116th to 92nd. These are among the four biggest rises for current Top 100 teams (the other one: Evansville, from 128th to 96th). On the flipside, Ole Miss (36th to 58th) and Kentucky (33rd to 53rd) are among the biggest tumbles.
  • The SEC still has a ton riding on the next couple of weeks, then. The conference could end up with anywhere between two and five teams, six if Arkansas gets smoking hot. Three seems most likely, however.
  • Other three-week tumbles: Illinois State (74th to 103rd), Cincinnati (21st to 41st), Baylor (46th to 61st) and Butler (15th to 29th).

Who's overrated?

Wisconsin (20-9) - It's hard to figure out what the hell to do with a team capable of winning at Indiana, destroying Ohio State (by 22 in Madison) and losing (by 13) to Purdue at home. The Badgers are 11-5 in a tough conference and a firm No. 4 seed in the mocks, but I had them right on the 6-7 border. That's probably unfair, especially considering their No. 8 Pomeroy ranking, but their non-conference RPI was poor (they played four good teams and went 0-4 with an average loss of 11 points), and their 4.5 road-neutral wins (I count road wins as 1, neutral as 0.5) are among the lowest among current tourney teams.

(Fine, I'll probably have them higher next week.)

Notre Dame (22-7) - Lose to St. Joseph's, beat Louisville. Lost to Providence and St. John's, beat Pittsburgh on the road. Pomeroy's numbers are not a fan of the Irish, and it's not hard to see why -- three iffy losses and two overtime games versus DePaul -- but the big wins are pretty damn big. The Matrix has them a 7, but I have them a 10.

Baylor (16-12) - According to the Matrix, Baylor is one of the first four teams out. I have them seventh out, just ahead of Iowa and Arkansas. The Bears' second-best win is over Kentucky (best: Oklahoma State), and they have lost seven of 10, losing to every decent-to-good team they've played in that stretch. It's a stretch to say they've got a chance at the moment. But if they hadn't botched the end of the Kansas State game...

(I could have just as easily put Villanova here. I have them on the outside looking in, while the Matrix has them a 12.)

Who's underrated?

VCU (23-6) - They're 17th in Pomeroy's rankings and 31st in the RPI; that alone suggests they should be somewhere around a 6-seed, not the 8 they're getting in the Matrix. They have just one iffy loss (at Richmond in overtime), though obviously their resume is hurt by a marquee win -- their best wins according to Pomeroy rank: No. 37 Memphis, No. 40 Belmont, No. 60 Butler. Still, they're 11-3 in a good conference. They certainly have an opportunity to finish strong, first in a revenge attempt versus Richmond on Wednesday, then at Temple on Sunday.

New Mexico (25-4) - The Lobos are No. 2 in RPI, are 10-3 away from home (7-3 on the road, 3-0 neutral), are 12-2 in an excellent Mountain West, and took out UConn (which would have been in the tourney without the APR ban) in non-conference for resume effect. I initially had them as an easy 2-seed, but the Matrix has them as the third No. 3. Not a huge difference, obviously, but I think they might be getting hurt by Gonzaga being on the No. 1 line. "Well we can't have two of them in the top eight..."

N.C. State (21-8) - As is customary, the most underrated teams on my list are mid-majors -- VCU, Creighton, New Mexico, Memphis, San Diego State -- but I'll give a quick shout-out to N.C. State, which should probably be creeping toward a 6-seed instead of the 8 they currently have in the Matrix. Of course, they can only get so much of a shoutout considering they lost to Wake Forest and have lost four straight to Top 90 teams. They can help themselves by beating a team with a pulse in the ACC Tournament. (They have to wait until then because they finish with Wake Forest and Florida State.)

Rising

We talked about SEC teams rising and falling pretty dramatically over the past month. Here are the teams who have risen notably in the last week.

UCLA (22-7) - The Bruins dodged a bullet with an overtime win (at home) over Arizona State, then pulled off a lovely resume-maker with a win over Arizona. Beat the Washington schools on the road this week, and they could be in line for a 6-seed heading into the Pac-12 tourney.

Virginia (20-9) - The Cavs are now 18th in Pomeroy's rankings, and they did themselves a major favor by beating Duke on Thursday. It would have been an even bigger favor, however, had they not laid an egg and lost at Boston College on Sunday. They went from out, to in, to right on the borderline.

Boise State (18-8) - This is another "who the hell knows?" team, but the Broncos have helped themselves out tremendously of late. They beat Colorado State by 13 on Saturday after pasting Nevada on Wednesday. Losses to Nevada (in January) and Utah (in December) still make their resume a little iffy, but at 20-8, 8-6 in a good league, 44th in RPI and 52nd in Pomeroy, I think they might get in if the selection show were today.

Falling

Charlotte (18-10) - The 49ers fooled people into thinking they might be a tourney team after a win at Butler. That they followed that win up with losses by double-digits to St. Louis and Temple didn't finish them off ... but 21-point losses to Dayton and St. Bonaventure did. They're sinking like a stone.

Indiana State (16-13) - My numbers kind of liked ISU as a bubble team a couple of weeks ago. Then they lost to Drake and Evansville after barely beating Iona. So never mind on that one.

Wichita State (24-7) - Gregg Marshall's Shockers are still pretty safe, but it's probably not a good idea to head into Championship Week with a home loss to Evansville and a 12-point loss at Creighton.

Last Few In

Names in italics would be among the last in without their conference's automatic bid.

Wichita State (24-7)
Cincinnati (20-9)
Middle Tennessee (27-4)
Belmont (22-6)
California (20-9)
Boise State (18-8)
La Salle (20-7)
Temple (21-8)
Virginia (20-9)
Louisiana Tech (25-3)
Akron (22-6)
Iowa State (19-10)
Stephen F. Austin (20-3)
Kentucky (20-9)
Bucknell (24-5)
Southern Miss (20-7)

First Few Out

Villanova (17-12)
Maryland (20-9)
Ole Miss (21-8)
Tennessee (17-11)
UMass (18-9)
Baylor (16-12)
Iowa (18-11)
Arkansas (18-11)

By Conference

7 - Big East
5 - Atlantic 10, ACC, Big 12, Mountain West, Pac-12
3 - SEC
2 - Conference USA, Missouri Valley, West Coast

The Bracket

FIRST FOUR (in Dayton)

Virginia (20-9) vs. Southern Miss (20-7)
Iowa State (19-10) vs. Kentucky (20-9)

Northeastern (19-11) vs. Southern (18-9)
N.C. Central (17-8) vs. Gardner-Webb (17-11)

EAST REGIONAL (in Washington, DC)

1 Duke (25-4) vs. 16 Robert Morris (22-9)
8 Creighton (24-7) vs. 9 Illinois (20-9)
in Lexington

5 VCU (23-6) vs. 12 Louisiana Tech (25-3)
4 Kansas State (23-5) vs. 13 Bucknell (24-5)
in Kansas City

6 Colorado State (20-7) vs. 11 Belmont (22-6)
3 Michigan State (21-7) vs. 14 Stony Brook (22-6)
in Auburn Hills

7 UCLA (22-7) vs. 10 St. Mary's (25-5)
2 Louisville (24-5) vs. 15 Harvard (16-9)
in Lexington

WEST REGIONAL (in Los Angeles)

1 Gonzaga (28-2) vs. 16 Pacific (15-12)
8 Missouri (21-8) vs. 9 Colorado (19-9)
in San Jose

5 St. Louis (23-5) vs. 12 Virginia / Southern Miss
4 Ohio State (21-7) vs. 13 Akron (22-5)
in Dayton

6 Pittsburgh (23-7) vs. 11 California (20-9)
3 New Mexico (25-4) vs. 14 South Dakota State (19-9)
in Salt Lake City

7 Wisconsin (20-9) vs. 10 Cincinnati (20-9)
2 Miami (23-5) vs. 15 Weber State (20-5)
in Austin

MIDWEST REGIONAL (in Indianapolis)

1 Indiana (25-4) vs. 16 Northeastern / Southern
8 North Carolina (20-8) vs. 9 Oklahoma (19-9)
in Dayton

5 Oklahoma State (22-6) vs. 12 La Salle (20-7)
4 Syracuse (22-7) vs. 13 Iowa State / Kentucky
in Philadelphia

6 Memphis (25-4) vs. 11 Boise State (18-8)
3 Arizona (23-6) vs. 14 Valparaiso (23-7)
in Salt Lake City

7 N.C. State (21-8) vs. 10 Wichita State (24-7)
2 Georgetown (23-4) vs. 15 Loyola-Maryland (21-10)
in Philadelphia

SOUTH REGIONAL (in Arlington)

1 Kansas (25-4) vs. 16 N.C. Central / Gardner-Webb
8 San Diego State (18-8) vs. 9 Oregon (23-6)
in Kansas City

5 UNLV (21-7) vs. 12 Temple (21-8)
4 Marquette (21-7) vs. 13 Stephen F. Austin (20-3)
in San Jose

6 Minnesota (20-9) vs. 11 Middle Tennessee (27-4)
3 Florida (23-5) vs. 14 Davidson (22-7)
in Austin

7 Butler (21-7) vs. 10 Notre Dame (22-7)
2 Michigan (23-5) vs. 15 Florida Gulf Coast (19-10)
in Auburn Hills

My At-First-Glance Final Four

Louisville-Gonzaga-Georgetown-Michigan

Second glance: Duke-Ohio State-Indiana-Florida

Missouri's inevitable path to destiny (ahem)

Colorado-Gonzaga-Ohio State-Miami-Louisville-Georgetown. Not bad.

Mizzou Links, 3-5-13

$
0
0
Gyi0063977758

So my wife and I went on our first date 10 years ago today. Just thought I'd share. That's pretty awesome, and we're apparently pretty old.

Mizzou Basketball Links

Other Basketball Links

  • I Disagree With Sooooooooo Much Of This
    SI.com: The Ultimate College Basketball Broadcaster Draft

Mizzou Football Links

  • 2014 Recruiting
    PowerMizzou: Grant Jones joins the family
    PowerMizzou: Daily Recruiting Blast: March 4
    PowerMizzou: [Illinois TE Ian] Bunting has Mizzou ties
  • Oy
    The Trib (Dave Matter): Tigers miss on star recruit? Oops, my bad
  • Oh Hello There, Spring Football (By The Way, Mizzou Has An Incumbent Starting Quarterback, And His Name Is James Franklin)
    PowerMizzou: Spring Preview: Quarterback

EXPANSIONAPALOOZA™ 2013

  • Big East
    Frank the Tank: Revenge of the Ballers: Why Football Isn't Everything in Conference Realignment

Mizzou Diamond Sports Links

Other Mizzou Links

  • Mizzou Women's Basketball
    MUtigers.com: Liz Smith Named to Community Service Team

Other

Know your "Welcome Back, Mike": Arkansas

$
0
0
20130216_kkt_bh2_044

First, let's talk about Mike Anderson.

If you have any serious, burning resentment for Mike Anderson, you might need to seek professional help. Yes, he left. Coaches leave. In this regard, Missouri has been incredibly lucky in one sense (Mizzou didn't lose a coach to another school for more than 50 years), and unlucky in another (aside from Norm Stewart and brief times with Quin Snyder and Gary Pinkel, nobody wanted Missouri coaches).

Yes, he flirted with other schools before leaving. Welcome to Jimmy Sexton's world.

Yes, he said he wanted to "retire at Mizzou." People say things. And people say things they might change their minds about soon after saying them. Maybe it was a bold-faced lie. Maybe it was simply him saying he was content staying at Missouri forever (if other schools didn't come calling, or if he didn't get fired at some point).

Yes, I guess his departure was handled poorly, or at least with unfortunate timing. Word hit the Internet before he could get back to Columbia to tell his team. He also came back. He didn't tell his team via forwarded text. He came back for his former players' graduation last year.

(Yes, he also went to great lengths to avoid the media on his way into, and out of, town. I'm sorry, but I just found the thought of Eric Blumberg trailing Anderson's car funny. I'd have avoided them too.)

Yes, Anderson failed to sign anybody in the 2011 recruiting class, particularly one mister Otto Porter. And yes, he failed to sign anybody in what was a strangely loaded, top-heavy 2011 recruiting class in the state of Missouri -- Porter, Brad Beal, B.J. Young. He also left Frank Haith with Marcus Denmon, Phil Pressey, Kim English, Ricardo Ratliffe and Mike Dixon.

(Yes, he also potentially handled the first set of Dixon allegations poorly. I have no comeback for this one.)

Mike Anderson also inherited a program in relative shambles, with very few scholarships to give and a fanbase that had been completely beaten down over the previous three seasons. Here's the roster he inherited heading into 2007-08: Marshall Brown, Leo Lyons, Kalen Grimes, Matt Lawrence and Jason Horton. That's basically it. He honored commitments from Vaidatos Volkus and Keon Lawrence. He filled in immediate gaps with players he was recruiting at UAB -- Stefhon Hannah, Darryl Butterfield, some no-offense guard named J.T. Tiller. He had one scholarship to give in his first full year of recruiting (it went to Justin Safford). He was forced to deal with Athenagate and Grimes' dismissal. And he still improved the squad from 160th in Pomeroy's rankings in 2006, to 59th in 2007, to 44th (despite Athenagate) in 2008. And when he actually got a full class of recruits and transfers at his disposal (along with a finally healthy transfer by the name of Demarre Carroll), his team won the Big 12 tournament, made the Elite Eight, won 31 games, and brought back the pride Missouri Basketball had lost years earlier. The winter and early spring of 2009 were among my favorite months as a Missouri fan.

Missouri has now been to four straight NCAA Tournaments. At this point, the Tigers are basically locks to make it five straight this year. That will tie for the longest streak ever at Mizzou (1986-90, 1999-03). That wouldn't have happened without the dogged work of Mike Anderson. Long-term, as we get more separation from his departure, I'm pretty sure fans will regard him with a more pleasant tone. But honestly? Two years is long enough. If you're still angry, truly angry, at him, despite the time that has passed, and despite the simple fact that, since his departure, Missouri has improved and Arkansas really has not, then I don't know what to tell you. Sports might not be for you. THAT SAID...

...boo him like crazy tonight, not because of any deep-seated hostility, but because it's fun. At their best, sports allow you to act in ways that you wouldn't be allowed to act in the real world. (And at their worst, sports give people implicit permission to go way, way too far with that.) Perhaps at first, Mizzou fans really were angry at Ryan Robertson for dissing the home-state Tigers in favor of Kansas, but after four years of booing him every time he touched the ball at the Hearnes Center, it just became fun to do so. You couldn't do it without smiling. That is the kind of hate Mike Anderson should see tonight. The "Suitcase Mike" stuff? Bring it on.

It's like Ezekiel Elliott picking Ohio State, then saying he'll "always be a Tiger." No, Zeke, you won't. I wish no harm upon you, and for all I care, you can go ahead and have a successful, long NFL career, but you don't get to be a Tiger. You picked Ohio State. For Mike Anderson, I hold no grudge, and I hold crazy respect for the job he did in both bringing wins to Mizzou Arena and setting the table for what looks like, after two years, a potentially more successful run by his successor. But if you ditch us, we get to boo you when you come back. It's the way it's supposed to work.

Arkansas Razorbacks Since Last Time (3-2)


UAOpp.
Pace (No. of Possessions)
68.2
Points Per Possession (PPP)
0.940.96
Points Per Shot (PPS)
1.071.25
2-PT FG%44.6%47.8%
3-PT FG%27.8%31.3%
FT%59.2%66.9%
True Shooting %46.5%52.2%


UAOpp.
Assists/Gm12.411.2
Steals/Gm8.06.0
Turnovers/Gm12.815.4
Ball Control Index (BCI)
(Assists + Steals) / TO
1.591.12


UAOpp.
Expected Off. Rebounds/Gm13.310.8
Offensive Rebounds/Gm13.49.8
Difference+0.1-1.0

It's always weird previewing a team with a really short turnaround, so I'll just say this: Since the first time I previewed Mizzou-Arkansas, Arkansas has rebounded well, played good defense, and lost any and all sense of reliability on the offensive end. As we'll see below, the team's offensive leaders have regressed to a point, while others are still in the process of emerging. Depth has saved Mike Anderson's team, but the Hogs have some serious work to do to somehow scrape into the NCAA Tournament this year.

Ken Pomeroy Stats

UA Offense vs MU Defense Ranks

UA OffenseMU DefenseAdvantage
Efficiency9280push
Effective FG%17692MU
Turnover %11292UA big
Off. Reb. %16444MU big
FTA/FGA23734MU big
MU Offense vs UA Defense Ranks

MU OffenseUA DefenseAdvantage
Efficiency961MU
Effective FG%71160MU
Turnover %11712UA big
Off. Reb. %6247MU big
FTA/FGA219307MU

Where the Hogs are weakest

From an advanced stats perspective, this is basically the same team we saw a short while ago. They still can't really shoot (73rd in 2PT% but 304th in 3PT% and 228th in FT%). They still foul too much, especially on the road. They still don't get many calls (knock on wood) away from home. They still don't rebound that well (164th in OR%, 247th in DR%), though they are indeed improving in that regard. They are still inexperienced (274th in Experience), and they are still rather small (206th in Effective Height).

Where they are best

The Hogs also still turn you over like crazy (12th in Def. TO%, 23rd in Steal%) and prevent you from taking the ball from them (11th in Off. TO%, fifth in Steal%). They still use their bench at a downright silly rate (fifth in Bench Minutes). And they are still all sorts of active on defense (23rd in Steal%, 24th in Block%). They are still Mike Anderson's team.

Arkansas Since Last Time

  • Wins (Team Rank is from KenPom.com)
    No. 22 Missouri (73-71)
    No. 33 Kentucky (73-60)
    No. 104 Georgia (62-60)
  • Losses
    at No. 1 Florida (54-71)
    at No. 99 LSU (60-65)

Three home wins, two road losses, Rinse, repeat. (That said, of course, the Hogs barely beat Georgia at home and almost knocked off LSU on the road, so the "always great at home, always terrible away" thing doesn't really work.)

Arkansas Player Stats Since Last Time

PlayerAdjGS*/GmGmSc/MinLine
Coty Clarke (6'7, 225, Jr.)21.20.8026.6 MPG, 12.0 PPG (76% 2PT, 71% 3PT, 72% FT), 6.8 RPG, 2.0 APG, 2.0 SPG, 1.2 TOPG, 3.2 PFPG
Marshawn Powell (6'7, 240, Jr.)11.00.4325.8 MPG, 14.8 PPG (47% 2PT, 19% 3PT, 62% FT), 4.8 RPG, 2.4 TOPG, 2.8 PFPG
Mardracus Wade (6'2, 176, Jr.)7.50.3025.2 MPG, 5.0 PPG (50% 2PT, 26% 3PT, 67% FT), 2.6 RPG, 2.2 SPG, 2.0 APG
Anthlon Bell (6'3, 190, Fr.)7.40.5912.5 MPG, 8.5 PPG (33% 2PT, 40% FT), 1.3 RPG
Michael Qualls (6'5, 205, Fr.)5.60.2820.0 MPG, 4.4 PPG (37% 2PT, 20% 3PT, 40% FT), 5.2 RPG, 1.2 BPG
Kikko Haydar (5'10, 162, Jr.)3.60.2415.2 MPG, 4.6 PPG (60% 2PT, 39% 3PT, 50% FT), 1.6 RPG, 3.0 PFPG
Rashad Madden (6'5, 181, So.)2.20.1613.6 MPG, 2.4 PPG (43% 2PT, 75% FT), 2.0 RPG, 1.8 APG
B.J. Young (6'3, 180, So.)1.50.0528.6 MPG, 9.2 PPG (44% 2PT, 6% 3PT, 56% FT), 3.4 RPG, 2.0 APG, 3.2 TOPG, 2.6 PFPG
Hunter Mickelson (6'10, 245, So.)1.20.1012.0 MPG, 2.0 PPG, 1.8 RPG
Rickey Scott (6'3, 205, Jr.)0.90.0713.0 MPG, 2.0 PPG, 2.6 RPG
Fred Gulley (6'2, 177, Jr.)0.80.108.0 MPG, 1.0 PPG, 1.0 RPG

* AdjGS = a take-off of the Game Score metric (definition here) accepted by a lot of basketball stat nerds. It redistributes a team's points based not only on points scored, but also by giving credit for assists, rebounds (offensive & defensive), steals, blocks, turnovers and fouls. It is a stat intended to determine who had the biggest overall impact on the game itself, instead of just how many balls a player put through a basket.

  • Highest Usage%: Powell (35%), Bell (30%), Young (27%)
  • Highest Floor%: Clarke (58%), Haydar (37%), Madden (37%)
  • Highest %Pass: Madden (70%), Gulley (63%), Wade (62%)
  • Highest %Shoot: Bell (100%), Mickelson (59%), Powell (52%)
  • Highest %Fouled: Powell (21%), Scott (17%), Clarke (15%)
  • Highest %T/O: Mickelson (14%), Young (11%), Powell (9%)

The balance of power has taken a strange shift in recent weeks. Here are the top five Hogs in terms of AdjGS/game the first time I previewed this team: Powell (14.8), Young (14.7), Clarke (7.5), Mickelson (7.1), Wade (6.2). Powell's production has stayed reasonably similar, but seemingly everybody else has either improved or regressed dramatically. Young completely misplaced his game right around the time he was drawing the second of the two semi-bogus three-point plays at the end of the Missouri game. In the four previous games, he is averaging seven points, shooting 37% on 2-pointers and 0-for-12 on 3-pointers. But he isn't the only one to see a crazy shift.

Clarke: +13.7 Adj. PPG
Bell: +6.0 Adj. PPG
Madden: -2.5 Adj. PPG
Powell: -3.7 Adj. PPG
Scott: -4.4 Adj. PPG
Mickelson: -5.9 Adj. PPG
Young: -13.2 Adj. PPG

Now, momentum shifts occur over the course of the season. We should know that as well as anybody (cough Keion Bell, cough Laurence Bowers). But this is rather absurd. Bell, for instance, came out of absolute nowhere to score 17 points against Georgia (in the three games since, he has scored 17 points; in the 11 games before that one, he had scored nine).

For all we know, Young will find his groove again, and the offense will flow just fine. But it hasn't recently. Clarke has been amazing, but he's not a "the offense runs through him" guy (as evidenced by his 15% Usage Rate). Arkansas needs Powell and Young to play well to have a chance tonight. Not saying it won't happen -- it would be just Missouri's luck -- but all we know for sure is that it hasn't recently.

Keys to the Game

  1. The Whistles. Always. This is a game involving a Mike Anderson team.

  2. Mizzou Arena. Mizzou Arena is funny. When it is 100% into a game, which only happens once or twice a year, it has the power to cow both the visiting team and the home team. It seemed frequent in those old Kansas games that, when the stakes were high (primarily 2009 and 2012), both teams played a bit freaked out at first; and it happened again to an extent against Florida a couple of weeks ago. But that building can also carry the home team down the stretch. It is an amazing arena to behold in the final minutes of a rivalry game. And with the Anderson Effect, combined with Senior Night, I expect it at its best tonight. If Arkansas can overcome potential runs, keep the game close at the end, and then win in that environment, power to the Hogs.

  3. Tag Team. I could have gone with Phil Pressey here, and I could have gone with BCI! BCI! (this is a Mike Anderson game after all). Instead, though, I'm going with this. Over his last three games, Alex Oriakhi has averaged 17.3 points per game (on 72% shooting from the field) and 9.3 rebounds (4.3 on offense). And on Saturday, Laurence Bowers officially looked like Lawrence Bowers again, scoring 23 points and grabbing 10 boards. The battle between Bowers-Oriakhi and Clarke-Powell will likely decide the game. Lord knows Flipadelphia will play a role, as will plenty of other factors (ball-handling, rebounding, etc.). But this battle is absolutely enormous.

Prediction

Pomeroy projects an 81-70 Missouri win. Honestly, my gut says it won't be that close. It says Mizzou makes a couple of runs, maintains its recent, strong level of play, and Mizzou runs away, 85-65. That said ... strange things happen in rivalry games, and this has all the makings of a hell of a rivalry. Home court advantage can turn into a disadvantage against a defiant, fiery road team, and the dynamics of this game, with Anderson's return, Senior Night, etc., could be very interesting if Arkansas makes an early run of its own or keeps things close. (And lord knows that we are familiar with the "Anderson team gets dominated on the road, then makes a crazy late run to make things interesting" effect.) I expect a Missouri win tonight, but ... I also know that expecting any result of any kind might be pretty foolish. You never know.

Mizzou Links, 3-6-13

$
0
0
20130305_krg_ad9_171

First things first: Apologies to Fullback U. Rally Baby mocked him relentlessly for an hour straight yesterday at Shakespeares.

(And thanks to BST for throwing the game thread together. Actually having to leave the house totally threw me off.)

Mizzou Basketball Links

Okay, so ... that was fun, huh?

  • Mizzou >>>>>>>>>> Arkansas
    MUtigers.com: Bowers Leads Mizzou to 93-63 Senior Night Celebration
    MUtigers.com: Missouri Postgame Notes vs. Arkansas
    MUtigers.com: Postgame Quotes
    The Trib: Bowers has fitting sendoff, but Tigers could be far from done
    The Missourian: Haith animated in Missouri's victory over Arkansas
    The Missourian: Mike Anderson returns to Missouri to play the team he left
    KC Star: Fans delight as Missouri routs ex-coach Anderson and Arkansas 93-63
    KC Star: Hogs well cast for role of MU's bitter rival
    Post-Dispatch: Mizzou crushes Arkansas
    Post-Dispatch (Joe Strauss): One last bridge burns in Columbia
    PowerMizzou: Game at a Glance
    PowerMizzou: PHOTOS: The Baseline View
    PowerMizzou: PMTV-HD: Arkansas Post-Game
    The Maneater: Missouri routes Arkansas 93-63 in Mike Anderson's return
    KBIA Sports: Bowers, Mizzou welcome back Mike Anderson with a 93-63 win over Arkansas
    The Dagger: Mike Anderson receives hostile welcome in his return to Missouri
  • Senior Night
    The Trib: Bowers earns admiration for showing class through good times and bad
    The Missourian: Bowers recognizes Dixon in Missouri's senior night celebration
    The Missourian: STORIFY: Fans react to Laurence Bowers' recognition of Michael Dixon, Jr.
    KC Star: Three seniors play last game at Mizzou Arena
    PowerMizzou: Short but Sweet
    PowerMizzou: PMTV-HD: Senior Night Ceremony
    PowerMizzou: PMTV-HD: Senior Speeches
    YouTube: Laurence Bowers says goodbye to Mizzou Arena
  • SEC Tournament
    MUtigers.com: Limited SEC Tournament Tickets Made Available to Mizzou Fans

Mizzou Football Links

  • Spring Ball
    PowerMizzou: Spring Preview: Running back
  • 2014 Recruiting
    PowerMizzou: Daily Recruiting Blast: March 5
    PowerMizzou: Top Two for [CO OL Dalton] Risner
    PowerMizzou: Mizzou Gives [GA TE Cole] Cook His First SEC Offer

Other Football Links

Mizzou Diamond Sports Links

Other Mizzou Links

2013 UMass football's 10 things to know: Awkward timing, extreme youth

$
0
0
20120917_ter_aa1_115

Confused? Check out the glossary here.

1. Timing is everything.

The University of Massachusetts announced on April 20, 2011, that its football team would move up to FBS. At that point, the Minutemen were just three seasons removed from a CAA conference title and four seasons removed from a trip to the FCS national title game. If it had joined the MAC in 2006, the breaking-in period may have gone reasonably well. UMass ranked 59th in the 2006 Sagarin rankings, ahead of every MAC school but Central Michigan. In 2007, they ranked 77th, ahead of everybody (unless I missed someone).

By 2011, however, the program had lost a little bit of steam. Head coach Don Brown left Amherst to become Ralph Friedgen's defensive coordinator at Maryland, and Kevin Morris went just 5-6 in 2009 and 6-5 in 2010. The Minutemen went 5-6 again in 2011, and Morris was replaced by former Notre Dame offensive coordinator Charley Molnar. Insert a ton of injuries, put onto the field one of the most ridiculously young teams ever, and you have just about the worst FBS debut season imaginable.

Timing really hasn't been UMass' thing -- one could argue that the program should have made the FBS move 50 years ago -- but wow, was the timing bad in 2012. What seemed at one time to be a logical, well-timed decision quickly turned into a nightmare. It was so bad that, to some faculty, UMass' stay at the FBS level should have been cut very, very short.

2. It's not a good sign when the response to your first FBS season is a vote to leave FBS.

UMass Faculty Senate motion to leave FBS falls a vote short.

Back in December the Faculty Senate at Massachusetts voiced its concern over the increase of money the school was spending on its football program following a move from the FCS level to the FBS level. On Thursday, the Faculty Senate voted on a motion to have UMass football leave the FBS level and that motion failed by one vote.

The motion was beaten by a 19-18 vote with one abstention. Absent from the vote was professor Max Page. He had been the most vocal critic of the school's move to the FBS but was out of the country on Thursday and could not vote.

"Whatever else might be said of the 2011 decision to move to the next level, it was never presented as a one-year experiment," said chancellor Kumble Subbaswamy at Thursday's meeting. "It simply couldn't be. Like many decisions I inherited, it is my job to ensure the program's success in a responsible manner. That's what I intend to do. I have been consistent in this position. As with any major campus initiative we will carefully monitor the progress and the financial commitments associated with the process to ensure that the best interests of the university as a whole are always at the forefront."

Or, to put it another way, UMass football edges faculty for second FBS victory.

(Matt Sussman is awesome, by the way.)

2012 Schedule & Results

Record: 1-11 | Adj. Record: 0-12 | Final F/+ Rk: 122
DateOpponentScoreW-LAdj. ScoreAdj. W-L
30-Augat Connecticut0-37L(-4.7) - 37.1L
8-SepIndiana6-45L11.2 - 35.4L
15-Sepat Michigan13-63L18.6 - 47.9L
22-Sepat Miami (Ohio)16-27L20.6 - 31.3L
29-SepOhio34-37L32.1 - 33.2L
6-Octat Western Michigan14-52L16.8 - 44.3L
20-OctBowling Green0-24L(-1.2) - 18.9L
27-Octat Vanderbilt7-49L19.3 - 43.8L
3-Novat Northern Illinois0-63L14.7 - 43.6L
10-Novat Akron22-14W18.9 - 29.4L
17-NovBuffalo19-29L15.6 - 34.0L
23-NovCentral Michigan21-42L17.2 - 33.2L
CategoryOffenseRkDefenseRk
Points Per Game12.712440.2121
Adj. Points Per Game14.912436.0118

3. This team never had a chance in 2012.

Even with no injuries, this team wasn't going to be very good in its first FBS season. The team was too young, there was not enough FBS-level talent (even with the addition of some late senior transfers), and the new coaching staff was attempting to get its footing. But then quarterback Kellen Pagel was lost for the season to concussion-related issues (he is now on the UMass baseball roster, not the football roster), leaving two freshmen in his place. And the offensive line dealt with injuries and extreme youth. And the secondary dealt with xtreme-with-an-x youth. And after losing the top five 2011 targets from the receiving corps, almost nobody stepped up when given opportunities to make a mark. (The quarterback issues didn't help.) And a team that probably wasn't good enough to rank better than about 105th or 110th in the F/+ rankings instead became one of the two or three worst teams in the country.

If you're looking for a ceiling, however, look toward one specific game.

4. UMass almost beat Ohio.

Against an undefeated Ohio squad that had beaten Penn State about a month earlier, in front of a paltry 8,321 fans at Gillette Stadium, UMass almost pulled off a miracle.

The Minutemen gained 511 yards on a faltering Ohio defense, threw for 373 yards, moved the chains 28 times, took a 27-20 lead into the fourth quarter, faltered, rallied, and got to the Ohio 45-yard line with about 30 seconds left. But four straight incompletions ended an upset bid, and Ohio held on, 37-34. Quarterback Mike Wegzyn completed 27 of 51 passes for 373 yards and four scores, but it wasn't enough. We briefly got a glimpse of the potential of UMass' pistol attack, but that was just about the last time we would see potential in 2012.

Offense

CategoryYards/
Game Rk
S&P+ RkSuccess
Rt. Rk
PPP+ Rk
OVERALL124121121123
RUSHING118119119118
PASSING103123119123
Standard Downs123121123
Passing Downs113117108
Redzone119117117
Q1 Rk1181st Down Rk124
Q2 Rk1192nd Down Rk124
Q3 Rk1203rd Down Rk98
Q4 Rk124

Quarterback

Note: players in bold below are 2013 returnees. Players in italics are questionable with injury/suspension.

PlayerHt, Wt2013
Year
RivalsCompAttYardsComp
Rate
TDINTSacksSack Rate Yards/
Att.
Mike Wegzyn 6'5, 215 So. ** (5.4) 182 346 1,825 52.6% 6 10 25 6.7% 4.5
A.J. Doyle 6'3, 226 So. *** (5.5) 56 98 419 57.1% 3 8 7 6.7% 3.4
Ian Shultis


0100.0%0100.0%0.0
Brandon Hill 6'5, 218 Jr. NR


Todd Stafford 6'6, 240 Fr. ** (5.4)


5. Continuity would be a start.

Two freshmen got time at quarterback, four freshmen got opportunities at receiver, and four freshmen started at least one game on the line. The lineup we saw was not what we were supposed to see, but injuries were devastating to the UMass charge in 2012.

Some improved injury luck might allow the Minutemen to take advantage of what could be a lovely base of experience. This will be the case in 2014 more than 2013, probably, but this fall we'll still see a couple of interesting quarterbacks getting longer looks (both Mike Wegzyn and A.J. Doyle showcased at least a little bit of running ability and never had a chance to prove themselves as passers with this line and this receiving corps). We'll also see a potentially interesting corps of running backs, one that should include star freshman Lorenzo Woodley. The Minutemen almost certainly aren't going to win many games in 2013, but continuity and further experience could pay off dramatically in coming seasons.

Running Back

PlayerPos.Ht, Wt2013
Year
RivalsRushesYardsYards/
Carry
Hlt Yds/
Carry
TDAdj.
POE
Michael CoxRB1987103.63.95-31.6
Mike WegzynQB6'5, 215So.** (5.4)682984.43.02-7.5
Jordan BroadnaxRB5'9, 175Jr.NR511382.72.01-12.3
A.J. DoyleQB6'3, 226So.*** (5.5)20944.74.40-0.7
Jamal WilsonRB5'10, 190So.NR17482.82.60-3.8
Chris BurnsRB14201.42.80-4.3
Stacey BedellRB5'10, 180RSFr.*** (5.5)


Lorenzo WoodleyRB6'0, 210Fr.*** (5.7)


Receiving Corps

PlayerPos.Ht, Wt2013
Year
RivalsTargetsCatchesYardsCatch RateYds/
Target
Target
Rate
%SDReal Yds/
Target
RYPR
Deion WalkerWR935966763.4%7.222.6%57.0%7.267.6
Alan WilliamsWR724245058.3%6.317.5%50.0%6.045.6
Rob BlanchflowerTE6'4, 250Sr.NR704346461.4%6.617.0%50.0%6.347.0
Tajae SharpeWR6'2, 175So.** (5.4)512020639.2%4.012.4%51.0%4.120.9
Marken MichelWR5'10, 185Jr.*** (5.5)472822959.6%4.911.4%46.8%5.123.2
Jordan BroadnaxRB5'9, 175Jr.NR24148158.3%3.45.8%70.8%3.88.2
Michael CoxRB18136372.2%3.54.4%50.0%3.76.4
Bernard DavisWR6'1, 180So.** (5.4)1163254.5%2.92.7%63.6%3.03.2
Derek BeckWR6'4, 205So.NR832037.5%2.51.9%37.5%2.12.0
Elgin LongWR5'10, 189So.NR73-342.9%-0.41.7%71.4%-0.4-0.3
Brian DowlingWR


51620.0%1.21.2%80.0%0.90.6
Chris BurnsRB2213100.0%6.50.5%0.0%2.61.3
Ricardo Miller (Michigan)WR6'4, 226Sr.*** (5.7)


Rodney MillsWR6'1, 205RSFr.** (5.4)


Dalvin BattleWR5'10, 175RSFr.** (5.4)


Shaquille HarrisWR6'2, 185Fr.** (5.4)


D.J. WoodsWR5'10, 160Fr.** (5.4)


Offensive Line

CategoryAdj.
Line Yds
Std.
Downs
LY/carry
Pass.
Downs
LY/carry
Opp.
Rate
Power
Success
Rate
Stuff
Rate
Adj.
Sack Rate
Std.
Downs
Sack Rt.
Pass.
Downs
Sack Rt.
Team 83.0 1.843.9634.4%54.8%27.2% 87.2 2.9%10.2%
Rank 115 1246109116122 78 30107
PlayerPos.Ht, Wt 2013
Year
RivalsCareer Starts/Honors/Notes
Stephane MilhimLT37 career starts
Nick SpellerLG30 career starts
Quinton SalesC27 career starts
Anthony DimaRT6'7, 302Sr.NR20 career starts
Michael BolandLG6'7, 295So.** (5.3)6 career starts
John WallaceLG


4 career starts
Al LeneusRG6'2, 295So.NR2 career starts
Jamie CassleberryRG6'6, 280So.NR2 career starts
Matt SparksLG6'4, 275So.** (5.2)1 career start
Vincent WestcarrLT6'4, 308Sr.NR
Tyrell SmithRG6'5, 285So.** (5.2)
Malcolm SpellerLT
Josh BrunsOL6'5, 290Jr.** (5.2)
Sam ZeffOL6'5, 277Fr.** (5.4)
Jordan PageOL6'5, 302Fr.** (5.4)

6. The offensive line was crazy-young last year.

This time last year, UMass boasted three two-year starters on the line, which looked like a potential strength for an offense in need of one. The unit was still pretty awful, however (especially in run blocking), in part because of injuries. Nine players started at least one game, including four freshmen/redshirt freshmen. The pass protection was not horrible, but UMass was the worst in the country at opening holes on standard downs.

And now the Minutemen must replace their three most experienced starters.

Big Anthony Dima returns to anchor what will still be one of the younger lines in college football. UMass returns 31 career starts, 11 of which came from players who are now sophomores. This isn't a recipe for improvement, but with a load of sophomores and a new offensive line coach (former Cincinnati assistant Dave Johnson), things certainly look pretty good for 2014 and beyond. That's something.

Defense

CategoryYards/
Game Rk
S&P+ RkSuccess
Rt. Rk
PPP+ Rk
OVERALL104123123119
RUSHING117124122124
PASSING67119122110
Standard Downs124124120
Passing Downs11399114
Redzone122122122
Q1 Rk1161st Down Rk108
Q2 Rk1162nd Down Rk121
Q3 Rk1113rd Down Rk115
Q4 Rk111

Defensive Line

CategoryAdj.
Line Yds
Std.
Downs
LY/carry
Pass.
Downs
LY/carry
Opp.
Rate
Power
Success
Rate
Stuff
Rate
Adj.
Sack Rate
Std.
Downs
Sack Rt.
Pass.
Downs
Sack Rt.
Team 82.2 3.303.8443.3%75.0%15.8% 60.1 3.1%2.9%
Rank 121 111115113106105 118 105117
NamePosHt, Wt2013
Year
RivalsGPTackles% of TeamTFLSacksIntPBUFFFR
Hafis WilliamsDT1236.55.3%500210
Stanley AndreDE6'2, 240Jr.** (5.3)1228.54.1%410010
Chaz ThompsonDT1228.04.0%60.50000
Kevin ByrneDE6'3, 290Sr.NR1220.53.0%420011
Ryan DelaireDE6'4, 245Jr.NR814.52.1%52.50010
Galen ClemonsDT6'2, 275Sr.NR912.01.7%0.500100
Trey SealsDE6'4, 231So.NR127.51.1%110100
Daniel MaynesDT6'2, 250Jr.NR66.50.9%000100
Brandon PotvinDE6'1, 262Sr.NR126.00.9%110000
Robert KitchingDT6'1, 300So.**71.50.2%000000
Peter NgobidiDE6'1, 210Fr.** (5.4)


Linebackers

NamePosHt, Wt2013
Year
RivalsGPTackles% of TeamTFLSacksIntPBUFFFR
Perry McIntyreILB1296.513.9%7.530400
Kassan MessiahOLB6'4, 215So.** (5.2)943.56.3%310200
Tom BrandtOLB6'0, 215Sr.NR1229.54.2%101010
Jovan Santos-KnoxOLB6'2, 235So.NR1021.53.1%400201
John RobinsonILB6'2, 225So.** (5.2)108.01.2%000001
Tim BrandtOLB6'0, 212Sr.** (4.9)107.51.1%000100
Greg HilliardLB6'3, 205Jr.NR36.00.9%200011
D.J. AdeobaLB43.00.4%000000
Rob O'ConnorLB6'1, 220Sr.NR21.50.2%000000

Secondary

NamePosHt, Wt2013
Year
RivalsGPTackles% of TeamTFLSacksIntPBUFFFR
Darren ThellenS1262.08.9%103310
Randall JetteCB5'11, 175So.** (5.4)1241.56.0%102400
Joe ColtonS5'10, 187So.NR1138.05.5%101220
Trey Dudley-GilesCB5'11, 170So.** (5.4)1135.05.0%0.500400
Khary Bailey-SmithS6'2, 190So.** (5.2)1234.04.9%102112
Christian BirtS6'2, 197Sr.** (4.9)625.03.6%0.501000
Ed Saint-VilS5'11, 190Jr.NR518.02.6%001100
Antoine TharpeCB5'10, 190Sr.NR514.52.1%201100
D'Metrius WilliamsCB6'0, 170So.** (5.2)1112.51.8%100610
Mike LeeDB310.01.4%101200
Quayshun SmithDB5'9, 160Jr.** (5.2)92.50.4%000000
Devin BrownCB5'11, 185Sr.NR72.00.3%000000
Iric HarrisDB5'8, 175So.** (5.4)21.50.2%000000
Arthur WilliamsDB6'3, 190Fr.** (5.4)


7. The secondary was crazy-young last year.

Few FBS units had to be shuffled around more than UMass' secondary. Thanks to injuries and attrition, 10 different Minutemen got the chance to record at least 10.0 tackles, only three of the 10 played in all 12 games, and by the end of the season, almost the entire two-deep (six of eight spots) consisted of freshmen and redshirt freshmen. Yikes.

Last year's shuffling, however, could turn into this year's strength. In sophomore corners Randall Jette, Troy Dudley-Giles and D'Metrius Williams, UMass has a trio that combined for two picks, 14 passes broken up, and 2.5 tackles for loss. Throw in four experienced safeties, and you've got a recipe for improvement, especially considering the front seven returns four players who made at least 4.0 tackles for loss last fall. There is almost literally nowhere to go but up for this defense, but overall the UMass D might be the first of the two major units to actually resemble an FBS unit.

Special Teams

PunterHt, Wt2013
Year
PuntsAvgTBFCI20FC/I20
Ratio
Colter Johnson6'3, 200Sr.6443.8571635.9%
Jeff Strait6'0, 197Sr.942.002022.2%
KickerHt, Wt2013
Year
KickoffsAvgTBTB%
Brendon Levengood6'1, 197Sr.3960.71025.6%
Place-KickerHt, Wt2013
Year
PATFG
(0-39)
PctFG
(40+)
Pct
Blake Lucas5'8, 160So.8-97-887.5%0-0N/A
Brendon Levengood6'1, 197Sr.6-73-475.0%0-10.0%
ReturnerPos.Ht, Wt2013
Year
ReturnsAvg.TD
Jordan BroadnaxKR5'9, 175Jr.4421.20
Marken MichelKR5'10, 185Jr.916.10
Trey Dudley-GilesPR5'11, 175So.148.00
Brian DowlingPR

51.00
CategoryRk
Special Teams F/+79
Net Punting86
Net Kickoffs67
Touchback Pct95
Field Goal Pct40
Kick Returns Avg85
Punt Returns Avg75

8. Special teams was, and should again be, a relative strength.

UMass' special teams unit was far from perfect -- iffy returns, few touchbacks on kickoffs, iffy punting -- but UMass made 10 of 12 field goals under 40 yards and covered kickoffs well. And in the absence of other strengths, this is something on which you can hang your hat.

2013 Schedule & Projection Factors

2012 Schedule
DateOpponentProj. Rk
31-Augat Wisconsin14
7-SepMaineNR
14-Sepat Kansas State40
21-SepVanderbilt49
5-Octat Bowling Green67
12-OctMiami (Ohio)106
19-Octat Buffalo101
26-OctWestern Michigan93
2-NovNorthern Illinois50
16-NovAkron120
23-Novat Central Michigan96
29-Novat Ohio83
Five-Year F/+ Rk124
Two-Year Recruiting Rk124
TO Margin/Adj. TO Margin*-9 / -7.2
TO Luck/Game-0.7
Approx. Ret. Starters (Off. / Def.)9 (4, 5)
Yds/Pt Margin**+10.5

9. Whatever UMass might become, it's still a year away from starting to become it.

The schedule features just four teams projected 100th or worse in the F/+ projections, and only two projected worse than Miami (Ohio) at No. 106. Considering 100th-105th is just about the best UMass can hope for with its continued youth, that suggests that the Minutemen are not going to win many games this fall.

That said, last year's ridiculously young team is still going to be young in 2013; if it sticks together, UMass will have one of the most experienced teams in the MAC come 2014-15. In players like Mike Wegzyn, Lorenzo Woodley, a host of young receivers and offensive linemen, and a defense that will feature perhaps as few as 6-7 seniors on its two-deep, there is a core around which Charley Molnar can build.

We don't know about the overall level of talent yet, and returns aren't amazingly promising, but in a year or two we might find that things are improving swiftly in Amherst.

10. Victor Cruz is really good.

Just saying. If UMass can produce him, it can produce a few more like him at some point.

(I really wanted to end this on a positive note.)

More in College Football:

SB Nation exclusive with Bobby Petrino, football mind

New Oregon State logo, football uniforms revealed

This Alabama tattoo will haunt your dreams

All in, at last: SB Nation inside Gus Malzahn's Auburn

Kliff Kingsbury isn't GQ enough

The speed conspiracy: Comparing NFL and high school 40-yard dash times

Study Hall: Mizzou 93, Arkansas 63

$
0
0
20130305_krg_ad9_180

Your Trifecta: Bowers-Brown-Ross. Your winner: nobody!

I've never bought in, 100 percent, to the "Defense is all about effort" narrative. Sure, effort matters, but so do execution and general basketball smarts, right? Well ... last night showed that effort is a good percentage of the equation. A team that hadn't played defense since the Florida game, allowed 22 points on 31% shooting with four turnovers, almost no second-chance opportunities and multiple desperation 3-pointers in a frenzied first half. Arkansas got the game it wanted -- up-and-down chaos for spells, lots of turnovers for Missouri -- and couldn't put the ball in the basket to save its life. That was tremendous. Of course, it also showed what this team is capable of. If Tennessee averages 1.15 points per possession this coming weekend, it will now be doubly annoying. But wow, what an effort. Sure, things loosened up in the second half. That tends to happen when you're up 26 after 20 minutes.

Mizzou 93, Arkansas 63

Mizzou
UA
Pace (No. of Possessions)71.3
Points Per Possession (PPP)1.310.88
Points Per Shot (PPS)1.861.05
2-PT FG%61.1%57.1%
3-PT FG%50.0%24.0%
FT%70.0%38.5%
True Shooting %68.8%47.9%
MizzouUA
Assists1312
Steals79
Turnovers1511
Ball Control Index (BCI)
(Assists + Steals) / TO
1.331.91
MizzouUA
Expected Offensive Rebounds1013
Offensive Rebounds115
Difference+1-8

"Settling"

During his mid-timeout ESPN interview in the first half, Mike Anderson said his team was settling for 3-pointers and not getting the ball inside. And he was right. But his team also had almost nowhere to go with the ball inside. Last night we really did see in practice the defense we could see in theory: long arms impacting every pass and grabbing every rebound, muscle on the perimeter, et cetera.

We also saw this. And it was fantastic.

(Jamie Squire/Getty Images)


Apparently Frank Haith and Mike Anderson made nice after the game, but ... you get the impression that Haith was looking for a fight heading into this one. I don't think many Mizzou fans minded.

Mizzou Player Stats

(Definitions at the bottom of the post.)

Player
AdjGSGmSc/MinLine
Laurence Bowers27.81.0726 Min, 24 Pts (10-13 FG, 1-1 3PT, 3-5 FT), 11 Reb (4 Off), 2 Blk
Jabari Brown19.00.6131 Min, 23 Pts (6-12 FG, 3-6 3PT, 8-9 FT), 2 TO
Earnest Ross13.40.5226 Min, 11 Pts (3-7 FG, 2-4 3PT, 3-4 FT), 2 Reb (2 Off), 2 Ast, 3 Stl
Alex Oriakhi10.10.4025 Min, 10 Pts (3-3 FG, 4-4 FT), 8 Reb, 3 TO
Tony Criswell9.60.4422 Min, 7 Pts (3-3 FG, 1-2 FT), 7 Reb
Phil Pressey5.40.1830 Min, 8 Pts (2-3 FG, 1-1 3PT, 3-7 FT), 6 Ast, 4 Reb, 5 TO
Keion Bell4.60.1924 Min, 8 Pts (2-7 FG, 4-5 FT), 4 Reb
Negus Webster-Chan1.00.157 Min, 1 Pt (0-1 FG, 1-2 FT), 2 Ast
Dominique Bull1.01.031 Min, 1 Pt (1-2 FT)
Ryan Rosburg0.30.113 Min
Danny Feldmann0.30.341 Min
Corey Haith-0.5-0.461 Min
Stefan Jankovic-0.8-0.273 Min
PlayerUsage%Floor%Touches/
Poss.
%Pass%Shoot%Fouled%T/O
Bowers30%63%2.525%55%15%4%
Brown28%45%2.422%45%25%8%
Ross18%42%2.552%31%13%4%
Oriakhi15%49%1.00%34%33%34%
Criswell9%79%0.60%67%33%0%
Pressey18%39%4.573%6%10%10%
Bell21%34%2.134%40%21%6%
NWC20%31%6.177%7%10%7%
  • A perfect Laurence Bowers stat line. Just perfect.
  • I'll say this, Jabari Brown: if you score 23 points on 12 shots, you are allowed to contribute nothing else to the box score.
  • Earnest Ross with his sneakiest box score of the year. I had no idea he was going to be in the trifecta as I was punching in the numbers.
  • Last 6 Games
    Oriakhi 15.0 Adj. PPG
    Bell 13.9
    Bowers 13.3
    Pressey 12.4
    Brown 10.4
    Ross 9.1

    I mean, that's pretty much exactly what you want to see, right? Mizzou is averaging 1.18 points per possession in its last six contests, which is just silly. Not quite "Mizzou in 2011-12" silly, but close. Of course, the 1.04 points per possession allowed still leaves something to be desired, but again, we saw what this D is capable of last night. Now do it again.

Three Keys Revisited

From yesterday's preview.

The Whistles

Always. This is a game involving a Mike Anderson team.

Fouls: Arkansas 29, Missouri 11
Free Throws: Missouri 40, Arkansas 13

Yeah, I'd say that worked out in Missouri's favor. Mizzou had a pretty clear mission: When you beat the pressure, go to the rim. And while the Tigers were committing turnovers like crazy there for a while (seven in the first seven minutes), they were also inducing all sorts of reach-in fouls while attacking the rim. And when they didn't get fouled, they probably got an offensive rebound. Oh yeah, and they were making five of nine 3-pointers to boot. It's hard to commit 10 first-half turnovers and lead by 26 at halftime, but that's the blueprint.

Mizzou Arena

Mizzou Arena is funny. When it is 100% into a game, which only happens once or twice a year, it has the power to cow both the visiting team and the home team. It seemed frequent in those old Kansas games that, when the stakes were high (primarily 2009 and 2012), both teams played a bit freaked out at first; and it happened again to an extent against Florida a couple of weeks ago. But that building can also carry the home team down the stretch. It is an amazing arena to behold in the final minutes of a rivalry game. And with the Anderson Effect, combined with Senior Night, I expect it at its best tonight. If Arkansas can overcome potential runs, keep the game close at the end, and then win in that environment, power to the Hogs.

Yeah, I don't think Mizzou was cowed too much by the home crowd. Arkansas had a couple of decent spells in the first half -- a 7-0 run from 18:07 to 15:53, a quick little 4-0 spurt from 11:08 to 10:15 -- but Mizzou was relentless.

5-0 from 20:00 to 18:50.
9-2 from 14:37 to 13:45.
7-0 from 12:46 to 11:08.
9-0 from 9:56 to 7:47.
13-0 from 3:55 to halftime.

Arkansas went on a quick 10-2 run to start the second half, but this was a fifth-round knockout. And the arena played its part

Tag Team

I could have gone with Phil Pressey here, and I could have gone with BCI! BCI! (this is a Mike Anderson game after all). Instead, though, I'm going with this. Over his last three games, Alex Oriakhi has averaged 17.3 points per game (on 72% shooting from the field) and 9.3 rebounds (4.3 on offense). And on Saturday, Laurence Bowers officially looked like Laurence Bowers again, scoring 23 points and grabbing 10 boards. The battle between Bowers-Oriakhi and Clarke-Powell will likely decide the game. Lord knows Flipadelphia will play a role, as will plenty of other factors (ball-handling, rebounding, etc.). But this battle is absolutely enormous.

Bowers & Oriakhi: 51 minutes, 34 points (13-16 FG, 7-9 FT), 19 rebounds (5 offensive), 3 blocks, 1 steal
Clarke & Powell: 54 minutes, 18 points (8-16 FG, 1-6 FT), 4 rebounds (1 offensive), 3 blocks, 5 steals

Coty Clarke and Marshawn Powell made up a little bit of ground with blocks and steals, but this battle was no contest.

(Clarke, by the way, could play on my team any day. I really like watching that guy. Tremendous role player, perfect for Anderson's system. But I digress.)

Summary

What a night, huh?

---

AdjGS: a take-off of the Game Score metric (definition here) accepted by a lot of basketball stat nerds. It takes points, assists, rebounds (offensive & defensive), steals, blocks, turnovers and fouls into account to determine an individual's "score" for a given game. The "adjustment" in Adjusted Game Score is simply matching the total game scores to the total points scored in the game, thereby redistributing the game's points scored to those who had the biggest impact on the game itself, instead of just how many balls a player put through a basket.

Usage%: This "estimates the % of team possessions a player consumes while on the floor" (via). The usage of those possessions is determined via a formula using field goal and free throw attempts, offensive rebounds, assists and turnovers. The higher the number, the more prevalent a player is (good or bad) in a team's offensive outcome.

Floor%: Via Basketball-Reference.com: Floor % answers the question, "when Player X uses a possession, what is the probability that his team scores at least 1 point?". The higher the Floor%, the more frequently the team probably scores when the given player is involved.

Touches/Possession: Using field goal attempts, free throw attempts, assists and turnovers, Touches attempt to estimate "the number of times a player touched the ball in an attacking position on the floor." Take the estimated touches and divide it by the estimated number of possessions for which a player was on the court, and you get a rough idea of how many times a player touched the ball in a given possession. For point guards, you'll see the number in the 3-4 range. For shooting guards and wings, 2-3. For an offensively limited center, 1.30. You get the idea.

Anyway, using the Touches figure, we can estimate the percentage of time a player "in an attacking position" passes, shoots, turns the ball over, or gets fouled.


Mizzou Links, 3-7-13

$
0
0
20130305_krg_ad9_172

Mizzou Basketball Links

Mizzou Football Links

Mizzou Diamond Sports Links

  • Wins!
    MUtigers.com: Tiger Pitching Shines in Sweep of Double-Header
    The Missourian: Missouri sweeps home-opening doubleheader
    KBIA Sports: Mizzou baseball dominant in doubleheader home opener
    SimmonsField.com: HI NOTES: 2-0 At Home, $9.95 For Tex
  • Conference play already??
    MUtigers.com: No. 5 Softball Set for Home Series with No. 7 Texas A&M

Other Mizzou Links

  • Mizzou Women's Basketball
    The Trib: Wrapping up MU WBB's "great" season
    The Missourian: Point guards lead effort to reduce turnovers for Missouri women's basketball
    KC Star: WNIT is backup plan as Missouri women begin league tourney quest
  • Mizzou Track & Field
    MUtigers.com: Tigers Track Ready to Take on NCAA Indoor Championships
  • Mizzou Swimming & Diving
    The Missourian: Jamie Sweeney remembers Missouri diving's past in wake of recent success

2013 Eastern Michigan's 10 things to know: Searching for another window of opportunity

$
0
0
155121262

Confused? Check out the glossary here.

1. Sometimes things don't quite fall into place

To put it kindly, Eastern Michigan doesn't have much of a football history. The Eagles (then called the Hurons) experienced just one winning season in their first 11 years as a Division I program. They went 10-2 under Jim Harkema and won the California Bowl in 1987, won another 13 games in 1988-89 ... and have not won more than six games in a season since. Rick Rasnick went 6-5 in 1995. Ron English went 6-6 in 2011 (EMU was ineligible for a bowl that year because they won two games versus FCS teams). And that's your EMU football history.

The 2011 season was regretful. With a rather experienced team (English's third in Ypsilanti), it looked like EMU might have a path toward bowl eligibility and its first postseason appearance in 24 years. And that's how it's supposed to work, right? You scuffle along for a couple of years, get some of your kids in place, get some breaks from the schedule, and experience a lovely breakthrough. That leads to better recruiting, more success, et cetera. It looks great on paper, and sometimes actually works out the way it's intended to; but sometimes it doesn't work out.

EMU headed into November 2011 needing two wins in four games to reach bowl eligibility. The Eagles lost to Ball State, 33-31, on the heels of a last-second, 44-yard field goal. They handled Buffalo but fell to Kent State, 28-22, on a 70-yard, fourth-quarter touchdown pass. And late in a game with eventual MAC champion Northern Illinois, EMU got the ball with a chance to pull an upset. But a desperation drive stalled at midfield, and EMU lost, 18-12. Three great chances, three losses, one game short.

In 2012, the cycle began again. Ron English had to replace a ton of experience, due to graduation, injury and general attrition, and his fourth EMU squad regressed. Combined with a pretty tough schedule, EMU just never had a chance. That he got a fifth year in Ypsilanti is good -- too often, programs compound their struggles with an itchy trigger finger -- but one has to imagine he won't get too much more if his 2013 squad doesn't start to turn around the misfires of the previous fall.

2. The experience level is better this year

EMU doesn't have much of a senior class this season -- there is basically one senior starter on the offensive line, one on the defensive line, one or two at linebacker and one or two in the defensive backfield -- but last year's deluge of freshmen and sophomores is now a flood of sophomores and juniors. There are still serious question marks regarding experience at offensive line (three starters who had combined for 100 career starts are gone) and in the linebacking corps (four of the top five are gone), but EMU should expect to be both more experienced and better in 2013.

Probably not better enough, but you never know. The offensive backfield is legitimately interesting, and it could get even more interesting with the arrival of EMU's most highly touted recruit ever this fall.

2012 Schedule & Results

Record: 2-10 | Adj. Record: 1-11 | Final F/+ Rk: 110
DateOpponentScoreW-LAdj. ScoreAdj. W-L
30-Augat Ball State26-37L23.5 - 30.6L
8-SepIllinois State14-31L12.3 - 34.0L
15-Sepat Purdue16-54L18.4 - 44.7L
22-Sepat Michigan State7-23L16.7 - 37.9L
6-OctKent State14-41L23.3 - 29.8L
13-OctToledo47-52L43.0 - 49.2L
20-OctArmy48-38W28.3 - 36.4L
27-Octat Bowling Green3-24L18.1 - 29.9L
1-Novat Ohio14-45L19.6 - 41.9L
10-NovCentral Michigan31-34L27.5 - 27.4W
17-Novat Western Michigan29-23W29.4 - 32.3L
23-NovNorthern Illinois7-49L19.6 - 33.5L
CategoryOffenseRkDefenseRk
Points Per Game21.310037.6115
Adj. Points Per Game23.310635.6116

3. No hope in 2012

With a team stripped bare of experience, EMU's best hope for the first six games of 2012 (now that we know how much better Ball State and Kent State would become) was 1-5. EMU got thumped by a pretty good (for FCS) Illinois State team, and that basically clinched an 0-6 start. The Eagles were lucky to stay close to a field goal-happy Michigan State, and they almost won a shootout versus Toledo; plus they pulled it together, beat Army and Western Michigan, and almost took out Central Michigan (which would have denied the Chippewas bowl eligibility). But this was a "building for 2013" year from the start.

Offense

CategoryYards/
Game Rk
S&P+ RkSuccess
Rt. Rk
PPP+ Rk
OVERALL10510310899
RUSHING60878489
PASSING1089711288
Standard Downs989799
Passing Downs9310294
Redzone295717
Q1 Rk1121st Down Rk83
Q2 Rk1032nd Down Rk99
Q3 Rk633rd Down Rk111
Q4 Rk97

Quarterback

Note: players in bold below are 2013 returnees. Players in italics are questionable with injury/suspension.

PlayerHt, Wt2013
Year
RivalsCompAttYardsComp
Rate
TDINTSacksSack Rate Yards/
Att.
Tyler Benz 6'3, 215 Jr. ** (5.3) 114 212 1,511 53.8% 14 8 0 0.0% 7.1
Alex Gillett


459654846.9%5700.0%5.7
Brogan Roback 6'4, 185 Fr. **** (5.8)


4. Hello, marquee recruit

A four-star recruit from Toledo St. John's high school fielded interest from Cincinnati and a lot of midwestern schools and had received offers from most of the MAC by the middle of last summer. But on July 8, he committed to Ron English and EMU, and he never looked back. In the end, Rivals.com rated him the No. 17 pro-style quarterback in the country and a Top 20 prospect in the rich state of Ohio, but he remained committed to EMU, becoming the Eagles' most highly-touted signee ever in early February.

As such, one would worry about Brogan Roback getting thrown into the deep end too early. But with the return of Tyler Benz behind center, EMU won't be forced to immediately find out what they have in Roback if he's not blatantly ready to go. Benz was an interesting option when he replaced starter Alex Gillett (who moved to receiver) early in the season. He showed some big-play capability in the passing game (13.3 yards per completion is pretty high; each of EMU's top three targets averaged at least 13.4 per catch) and was a reasonably competent runner (4.9 yards per non-sack carry), but EMU was lacking terribly in efficiency. It was big-play-or-bust in 2012, and ... it was mostly bust. Still, there are worse options than Benz behind center.

Running Back

PlayerPos.Ht, Wt2013
Year
RivalsRushesYardsYards/
Carry
Hlt Yds/
Carry
TDAdj.
POE
Bronson HillRB5'10, 208Jr.** (5.2) 140 905 6.5 7.0 6 +14.3
Dominique SherrerRB662163.33.21-12.3
Alex GillettQB/WR594277.26.04+10.7
Ryan BrumfieldRB5'10, 185Jr.** (5.2) 57 164 2.9 3.0 1 -12.2
Tyler BenzQB6'3, 215Jr.** (5.3) 49 238 4.9 2.3 1 -2.2
Javonti GreeneRB5'10, 186Sr.NR 38 159 4.2 4.7 0 -2.7
Darius JacksonRB6'0, 215Jr.** (5.2)


Juwan LewisRB5'10, 218RSFr.*** (5.6)


5. Bronson Hill is explosive

EMU must replace its top receiver, but in junior receiver Donald Scott, sophomore Dustin Creel and tight end Tyreese Russell, the passing game still features some big-play threats (albeit ones who probably need to up their mostly awful catch rates a bit).

But the big-play threat in this offense is Hill, an October supernova last fall. Hill carried just seven times in five games but took over as primary ballcarrier against Toledo. In his first five games in that role, Hill carried 105 times for 724 yards. Keep that up for a full season, and you gain more than 1,700 yards. He gained just 106 yards in 28 carries in EMU's last two games, but he left his mark in October and early November.

Of the 114 FBS players with at least 140 carries in 2012, only 12 managed to average 7.0 highlight yards per carry, and only seven of those 12 were running backs: Arizona's Ka'Deem Carey, Oklahoma's Damien Williams, Kent State's Dri Archer, UCF's Latavius Murray, Utah State's Kerwynn Williams, Houston's Charles Sims and Hill. Highlight yards are, on paper, the yards you gain after the line has done its job; if the line could get Hill through the first level of the defense, Hill was capable of going a long, long way.

Of course, Hill will be taking blocks from a line that has to replace three two-year (or more) starters. Highlight yards don't really come into play unless you get the chance to create a highlight. There is some experience up front -- four returnees have started at least eight games -- but quite a bit less than last fall. New offensive coordinator (and former Ball State offensive coordinator and head coach) Stan Parrish has some toys in the skill position toybox, but a line that was a relative strength last year (37th in the country in Opportunity Rate, i.e. creating opportunities for its runners) might be a hindrance this time around.

Receiving Corps

PlayerPos.Ht, Wt2013
Year
RivalsTargetsCatchesYardsCatch RateYds/
Target
Target
Rate
%SDReal Yds/
Target
RYPR
Garrett HoskinsWR-Y623853761.3%8.721.4%51.6%8.862.9
Donald ScottWR-X5'8, 160Jr.** (5.3) 43 19 255 44.2% 5.9 14.8% 46.5% 5.7 29.9
Dustin CreelWR-Z6'2, 205So.** (5.2) 28 13 220 46.4% 7.9 9.7% 67.9% 8.0 25.8
Demarius ReedWR-H5'10, 161Jr.** (5.4) 28 18 171 64.3% 6.1 9.7% 53.6% 6.3 20.0
Tyreese RussellTE6'3, 242Jr.** (5.2) 26 12 196 46.2% 7.5 9.0% 53.8% 8.1 23.0
Alex GillettQB/WR181413277.8%7.36.2%38.9%7.015.5
Bronson HillRB5'10, 208Jr.** (5.2) 17 12 208 70.6% 12.2 5.9% 52.9% 11.2 24.4
Jay JonesWR-H5'10, 181So.** (5.0) 16 8 98 50.0% 6.1 5.5% 75.0% 5.1 11.5
Quincy JonesWR-X6'3, 209So.*** (5.7) 16 5 35 31.3% 2.2 5.5% 50.0% 2.0 4.1
Javonti GreeneRB5'10, 186Sr.NR 15 9 114 60.0% 7.6 5.2% 53.3% 7.2 13.4
Mitchell DawkinsWR6'3, 205So.** (5.3) 5 2 16 40.0% 3.2 1.7% 0.0% 2.1 1.9
Dominique SherrerRB521240.0%2.41.7%0.0%1.61.4
Ryan BrumfieldRB5'10, 185Jr.** (5.2) 4 3 34 75.0% 8.5 1.4% 100.0% 5.1 4.0
Dylan BrooksTE32566.7%1.71.0%0.0%0.70.6
Matt BoydFB212050.0%10.00.7%100.0%6.02.3
Christian MenetTE6'4, 255So.** (5.3) 2 1 1 50.0% 0.5 0.7% 100.0% 0.3 0.1

Offensive Line

CategoryAdj.
Line Yds
Std.
Downs
LY/carry
Pass.
Downs
LY/carry
Opp.
Rate
Power
Success
Rate
Stuff
Rate
Adj.
Sack Rate
Std.
Downs
Sack Rt.
Pass.
Downs
Sack Rt.
Team 92.9 2.702.9741.3%62.9%26.1% 90.0 3.3%8.4%
Rank 100 97813791119 75 3992
PlayerPos.Ht, Wt 2013
Year
RivalsCareer Starts/Honors/Notes
Andrew SorgatzLG46 career starts
Corey WatmanC30 career starts
Korey NealLT24 career starts
Campbell AllisonRG6'6, 316Jr.NR17 career starts
Lincoln HansenRT6'6, 301Jr.** (5.1)16 career starts
Bobby McFaddenRT6'7, 303Jr.** (5.2)9 career starts
Orlando McCordRG6'3, 310Sr.** (5.1)8 career starts
Josh WoodsLG6'4, 285Jr.** (5.2)
Jordan ErbesC6'5, 282Jr.** (5.3)
Jake HurcombeOL6'3, 302RSFr.** (5.4)
Dwayne BrownOL6'4, 320Fr.*** (5.5)
Kent CollinsOL6'2, 285Jr.** (5.2)

Defense

CategoryYards/
Game Rk
S&P+ RkSuccess
Rt. Rk
PPP+ Rk
OVERALL115112105114
RUSHING124116103119
PASSING38107104106
Standard Downs115103113
Passing Downs111110113
Redzone9268105
Q1 Rk971st Down Rk104
Q2 Rk1092nd Down Rk96
Q3 Rk1183rd Down Rk119
Q4 Rk108

Defensive Line

CategoryAdj.
Line Yds
Std.
Downs
LY/carry
Pass.
Downs
LY/carry
Opp.
Rate
Power
Success
Rate
Stuff
Rate
Adj.
Sack Rate
Std.
Downs
Sack Rt.
Pass.
Downs
Sack Rt.
Team 95.2 3.303.5246.5%79.5%14.3% 35.4 1.6%1.6%
Rank 77 11192121118116 123 123122
NamePosHt, Wt2013
Year
RivalsGPTackles% of TeamTFLSacksIntPBUFFFR
Andy MulumbaRUSH1250.07.2%710110
Cy MaughmerNT6'2, 278Jr.*** (5.6) 12 20.0 2.9% 2 0 0 0 1 1
Kalonji KashamaDE6'4, 270Sr.** (5.3) 11 19.0 2.7% 4 3 0 0 2 0
Travis LinserDT6'4, 288Jr.*** (5.5) 11 13.5 1.9% 4.5 1 0 0 1 0
Devin HendersonDT811.51.7%2.511000
Pat O'ConnorRUSH6'4, 272So.** (5.2) 12 11.0 1.6% 0 0 0 0 0 0
Omar McFarlaneDE6'1, 250So.NR 12 6.0 0.9% 0.5 0 0 0 2 0
Arron PipkinsNT6'1, 270So.** (5.2) 7 5.5 0.8% 0.5 0 0 0 0 0
Matt PriceDE6'3, 259Sr.NR 4 4.5 0.6% 0 0 0 0 0 0
Mike BrownDT6'3, 284So.** (5.2)


6. Wanted: pass rush

End Kalonji Kashama logged two sacks in the first three games of the year, one against Ball State and one against Purdue. He reeled in a third sack against Toledo. Those three sacks represented 43 percent of EMU's season total. There was simply no push up front. EMU's rush ends combined for one sack, the same number as EMU's safeties. And while linebackers Justin Cudworth and Bryan Pali did combine for 13 tackles for loss in 2012, a) none were sacks, and b) Cudworth and Pali are both gone.

Now, EMU did pull off a decent 23 sacks in 2011; they aren't that far removed from competency in this regard. But with little new blood in the rotation here, it is difficult to see the Eagles suddenly generating a decent pass rush again. That, combined with a new set of starting linebackers, will put a lot of pressure on EMU secondary ... again.

Linebackers

NamePosHt, Wt2013
Year
RivalsGPTackles% of TeamTFLSacksIntPBUFFFR
Blake PooleSLB1260.08.7%200110
Justin CudworthMLB1058.08.4%800212
Bryan PaliWLB958.08.4%500410
Hunter MattWLB6'1, 225So.** (5.4) 11 16.5 2.4% 1 0 0 2 0 0
Colin WeingradMLB413.01.9%1.501000
Sean KurtzWLB5'11, 224Sr.** (5.3) 12 10.0 1.4% 0.5 0 0 0 0 0
Ike SpearmanSLB6'1, 220So.*** (5.6) 6 2.5 0.4% 0 0 0 0 0 0
Tim BrownLB6'0, 218Jr.** (5.2)

Lavonte RobinsonLB5'11, 215Fr.** (5.4)


Secondary

NamePosHt, Wt2013
Year
RivalsGPTackles% of TeamTFLSacksIntPBUFFFR
Donald ColemanFS6'0, 205Sr.** (5.4) 11 58.5 8.4% 2 0 0 0 0 0
Alex BelfyFS1255.07.9%510413
Pudge CottonSS6'1, 218Jr.*** (5.7) 12 49.0 7.1% 3 0 2 0 0 1
Marcell RoseCB1245.56.6%1.502311
Darius ScottCB5'8, 160Jr.** (5.3) 9 22.0 3.2% 0 0 1 3 0 0
Kirkland BryantCB5'9, 177So.** (5.2) 12 19.5 2.8% 0 0 0 4 0 0
Kevin JohnsonSS5'11, 200Jr.** (5.2) 5 19.0 2.7% 1 0 0 1 0 0
Mycal SwaimSS6'4, 212Sr.** (5.2) 8 15.0 2.2% 0 0 0 1 1 0
Corey MannsCB129.51.4%000200
Marlon PollardDB13.00.4%000001
Dominique RouseDB21.00.1%000000
Kenyarda BatesDB5'6, 162Sr.NR 2 1.0 0.1% 0 0 0 0 0 0
Kris StrangeCB5'11, 178So.** (5.4)

Diondre Moore-YoungDB5'10, 180Jr.** (5.3)

Willie CreearDB5'10, 170Jr.** (5.2)

Jaleel CantyDB5'9, 191Fr.*** (5.5)

7. The secondary gets a boost

EMU's secondary needed some help, both because of its own iffy performance in 2012 and the complete lack of assistance it got from its pass rush. With two junior college transfers and a three-star freshman joining a senior safety (Donald Coleman) and a former star recruit (Pudge Cotton), it's easy to see this unit improving a bit. Whether that matters will depend on the front seven. Well, that, and the defensive coordinator, whoever that may be. Phil Snow is gone, but no replacement has been listed on EMU's website.

Special Teams

PunterHt, Wt2013
Year
PuntsAvgTBFCI20FC/I20
Ratio
Jay Karutz6942.73222466.7%
KickerHt, Wt2013
Year
KickoffsAvgTBTB%
Kody Fulkerson5'11, 190Sr. 52 58.5 3 5.8%
Place-KickerHt, Wt2013
Year
PATFG
(0-39)
PctFG
(40+)
Pct
Dylan Mulder6'0, 186So. 24-27 7-8 87.5% 3-3 100.0%
Kody Fulkerson5'11, 190Sr. 4-5 0-1 0.0% 0-0 N/A
ReturnerPos.Ht, Wt2013
Year
ReturnsAvg.TD
Tyler AllenKR5'8, 171Jr. 46 22.5 0
Dominique SherrerKR620.80
Demarius ReedPR5'10, 161Jr. 13 5.5 0
Alex BellfyPR54.40
CategoryRk
Special Teams F/+109
Net Punting21
Net Kickoffs118
Touchback Pct124
Field Goal Pct12
Kick Returns Avg78
Punt Returns Avg102

8. A mixed bag on special teams

Punter Jay Karutz was a lovely weapon for a team that, well, punted a lot, but with his departure, the special teams unit is relatively mediocre. Kicker Dylan Mulder was accurate on field goals (strangely, he was more accurate on those than on extra point attempts), and Tyler Allen showed a little bit of potential as a kick returner. But nobody on the team could get the ball into the end zone on kickoffs, and EMU gained almost as much yards on fair catches as it did when it actually tried to return punts.

2013 Schedule & Projection Factors

2012 Schedule
DateOpponentProj. Rk
31-AugHowardNR
7-Sepat Penn State24
14-Sepat Rutgers48
21-SepBall State84
5-Octat Buffalo101
12-Octat Army103
19-OctOhio83
26-Octat Northern Illinois50
2-Novat Toledo62
9-NovWestern Michigan93
23-NovBowling Green67
29-Novat Central Michigan96
Five-Year F/+ Rk120
Two-Year Recruiting Rk105
TO Margin/Adj. TO Margin*-5 / -1.4
TO Luck/Game-1.5
Approx. Ret. Starters (Off. / Def.)13 (8, 5)
Yds/Pt Margin**+2.9

9. Find six wins

It does appear that Ron English has improved his overall recruiting in recent years. Roback was a big get, and in players like running back Juwan Lewis, receiver Quincy Jones, freshman OL Dwayne Brown, a pair of defensive tackles, linebacker Ike Spearman, safety Pudge Cotton and incoming defensive back Jaleel Canty, English has built up the raw number of three- (or four-) star recruits in the rotation. But ... find six wins above. If you treat the 2013 projections as legitimate (your choice), EMU would probably need to improve to perhaps the mid-80s in the F/+ rankings to have a chance at six wins (they haven't ranked better than 102nd in the last seven years), and they play three of their five worst opponents on the road.

I see this team improving in 2013, but I don't see it improving enough to make a run at the postseason.

10. But on the bright side, this guy is still in the league

This is apropos of nothing, but in my first official home game as a college student, I watched Charlie Batch throw for 256 yards and two touchdowns. That he is still in the NFL, and still providing spot starts for Ben Roethlisberger in Pittsburgh (hey, 276 yards and an 89.6 passer rating against Baltimore in Week 13 this year), allows me to pretend I'm not as old as I actually am. Never retire, Charlie.

More in College Football:

SB Nation exclusive with Bobby Petrino, football mind

The 10 least powerful people in college football

Bracketology: Spencer Hall's Carnival of Stupidity

This Alabama tattoo will haunt your dreams

All in, at last: SB Nation inside Gus Malzahn's Auburn

The speed conspiracy: Comparing NFL and high school 40-yard dash times

Mizzou Links, 3-8-13

$
0
0
Secodds

Kudos to elpjuly4 for creating this helpful SEC odds image so we know what we're dealing with heading into the weekend. Tremendous work.

Mizzou Basketball Links

Mizzou Football Links

It makes perfect sense that Gary Pinkel is limiting media access to Mizzou practices this spring. Tons of coaches do that, and they especially do that a) after a poor season with a lot of negative media coverage and b) when they're breaking in a lot of changes to the offense. Still ... it's disappointing. I love the long, detailed practice reports, man.

  • Senior Day
    The Trib (Dave Matter): Missouri prospects work out for NFL scouts
    The Trib (Dave Matter): Speed sets apart Missouri's Gooden
    The Trib (Dave Matter): Richardson: I left on good terms
    The Missourian: Family helps Missouri's Zaviar Gooden prepare for NFL Draft
    The Missourian: Missouri pro day a big event for all involved
    KC Star: Richardson struts his stuff at Mizzou's Pro Day
    Post-Dispatch: Richardson gives a little extra at MU pro day
    PowerMizzou: No regrets for Sheldon Richardson
    We Are Mizzou: 2013 Mizzou Rising Seniors
    Mizzou Network (YouTube): 2013 Mizzou Pro Day Report
  • Spring Ball
    The Trib (Dave Matter): Missouri shrinks media access for spring practices

    For the first time in his 13 seasons at Missouri, Gary Pinkel is cutting media access during spring practices. In the previous 12 seasons, all portions of every practice were open for reporters to watch and all players and coaches, other than mid-year transfers, were available for interviews after practice. As they come off a 5-7 season and prepare for their second season in the Southeastern Conference, the Tigers have battened down the hatches.

    Starting with Tuesday's practice, media will be escorted away from the field after approximately the first 45 minutes of practice and will be allowed to return after practice to interview a select cast of players and coaches. Pinkel will be made available for only 10 of the 15 days that the Tigers practice. His assistant coaches will be available after only six practices. All three scrimmages, including the April 20 Black and Gold Game, will be open for the duration of the scrimmage.

    PowerMizzou: Spring Preview: Tight End
  • 2014 Recruiting
    PowerMizzou: [Illinois DE Dewayne] Hendrix's list continues to grow
    Al.com: Alabama monster hunt: Missouri OT Roderick Johnson latest behemoth to get offer
  • Tickets
    MUtigers.com: Mizzou Athletics Announces Launch of 2013 Football Season Ticket Request List
  • Steckel Looks ... Comfortable
    We Are Mizzou: Mizzou Tigers Riding in a Black Hawk

Mizzou Diamond Sports Links

Other Mizzou Links

  • Mizzou Women's Basketball
    MUtigers.com: Missouri Falls to Vanderbilt at SEC Tournament
    The Trib: Vanderbilt beats Missouri in SEC Tournament opener
    KC Star: MU falls to Vandy in SEC tourney 53-40
  • Mizzou Wrestling
    The Maneater: Tigers look to continue success at MAC championships
  • Mizzou Gymnastics
    The Missourian: Missouri gymnast Tori Howard prepares for final home meet
    The Maneater: Missouri gymnastics to honor seniors Friday night
  • Mizzou Tennis
    MUtigers.com: Mizzou Travels to Face Kentucky, Vanderbilt This Weekend
  • Mizzou Cross Country
    MUtigers.com: Cross Country Continues Making All-Academic Lists, Storms Earns Individual Honor
  • Mizzou Swimming & Diving
    Mizzou Network (YouTube): Mizzou Divers win SEC Titles

Know your Vol rival: Tennessee

$
0
0
20121130_lbm_aq3_060

Bring your lunch pail.

Tennessee Volunteers (18-11)


UT
Opp.
Pace (No. of Possessions)
63.4
Points Per Possession (PPP)
1.061.00
Points Per Shot (PPS)
1.281.18
2-PT FG%48.4%45.7%
3-PT FG%32.3%31.9%
FT%69.2%72.8%
True Shooting %53.4%51.1%


UTOpp.
Assists/Gm10.911.2
Steals/Gm4.26.4
Turnovers/Gm13.011.3
Ball Control Index (BCI)
(Assists + Steals) / TO
1.161.56


UTOpp.
Expected Off. Rebounds/Gm10.511.4
Offensive Rebounds/Gm11.99.8
Difference+1.4-1.6

Honestly? Tennessee doesn't have just a ton going for it. They are thin and inexperienced, their defense comes and goes, they lose the ball control battle more often than not, and they can't really shoot very well. But they're on the doorstep of a potential NCAA Tourney bid because they work really, really hard. That's it. That's the recipe. They hit the glass, they get to the line, they try to leverage you into iffy shots, they hit the glass, and they get to the line. They have one of the best rebounders in the country (Jarnell Stokes), they lower their head, and they work. As one would imagine, then, this makes them a pretty good home team. Home crowds tend to love hard work. And let's face it: officials tend to reward it, especially at home.

Ken Pomeroy Stats

UT Offense vs MU Defense Ranks

UT OffenseMU DefenseAdvantage
Efficiency4670UT
Effective FG%17993MU
Turnover %180293UT big
Off. Reb. %5736MU
FTA/FGA1833push
MU Offense vs UT Defense Ranks

MU OffenseUT DefenseAdvantage
Efficiency8102MU
Effective FG%6079push
Turnover %117298MU big
Off. Reb. %651MU
FTA/FGA183139UT

Where the Vols are weakest

They don't turn you over (298th in Def. TO%, 340th in Steal%), they can't shoot consistently (they're 144th in 2PT%, they're 243rd in 3PT% -- and that's withJordan McRae shooting 37% -- and they're 272nd in Off. Block%), they're not incredible passers (303rd in A/FGM), they're thin (248th in Bench Minutes), they're young (204th in Experience -- their four best players are a sophomore, a junior, a junior and a sophomore, and freshmen make up two-thirds of, basically, their three-man bench), and they tend to foul players who make their free throws (329th in Def. FT%), i.e. guards.

Where they are best

Again, they hustle. They rebound (57th in Off. Reb%, 51st in Def. Reb%), they get to the line and get you into foul trouble (18th in FTA/FGA), and they don't give you easy looks on defense (104th in Def. 2PT%, 84th in Def. 3PT%).

Tennessee's Season to Date

  • Wins (Team Rank is from KenPom.com)
    No. 1 Florida (64-58)
    No. 34 Wichita State (69-60)
    No. 44 Kentucky (88-58)
    No. 66 Alabama (54-53)
    No. 80 Xavier (51-47)
    vs. No. 91 UMass (83-69)
    No. 92 LSU (82-72)
    No. 95 Vanderbilt (58-57)
    at No. 95 Vanderbilt (58-46)
    at No. 98 Texas A&M (93-85, 4OT)
    at No. 186 Auburn (82-75)
    No. 190 Oakland (77-50)
    at No. 207 South Carolina (66-61)
    vs. No. 210 UNC Asheville (75-68)
    No. 241 Western Carolina (66-52)
    No. 260 Mississippi State (72-57)
    No. 332 Kennesaw State (76-67)
    No. 333 Presbyterian (78-62)
  • Losses
    vs. No. 15 Oklahoma State (45-62)
    at No. 17 Georgetown (36-37)
    at No. 21 Virginia (38-46)
    No. 40 Memphis (80-85)
    at No. 44 Kentucky (65-75)
    No. 51 Ole Miss (74-92)
    at No. 51 Ole Miss (56-62)
    at No. 66 Alabama (65-68)
    at No. 78 Arkansas (60-73)
    No. 96 Georgia (62-68)
    at No. 96 Georgia (68-78)

Average Score, Vols vs. Top 50 at home: Tennessee 75.3, Opponent 65.3 (+10.0)
Average Score, Vols vs. Top 50 away from home: Opponent 55.0, Tennessee 46.0 (-9.0)

This average is hilarious. Not only is Tennessee about 19 points better at home, but the home games average 140 total points ... and the road games 101. It's also dramatically skewed, of course, to the point where the numbers are basically useless -- the obscenely low-scoring Georgetown and Virginia losses were back-to-back and three months ago (and UT's offense has improved by quite a bit since then), and the home average includes the demolition of Kentucky -- but still.

Tennessee Player Stats

PlayerAdjGS*/GmGmSc/MinLine
Jarnell Stokes (6'8, 270, So.)15.70.5528.4 MPG, 12.4 PPG (53% 2PT, 56% FT), 9.3 RPG, 1.2 APG, 1.2 BPG, 2.0 TOPG
Jordan McRae (6'5, 178, Jr.)14.70.4433.5 MPG, 16.2 PPG (48% 2PT, 37% 3PT, 79% FT), 4.1 RPG, 2.0 APG, 2.7 TOPG
Trae Golden (6'1, 205, Jr.)11.40.3929.5 MPG, 12.1 PPG (42% 2PT, 29% 3PT, 78% FT), 4.1 RPG, 2.8 RPG, 2.0 TOPG
Josh Richardson (6'6, 188, So.)8.10.2730.5 MPG, 7.6 PPG (54% 2PT, 23% 3PT, 67% FT), 4.2 RPG, 1.4 APG, 1.8 TOPG, 2.5 PFPG
Kenny Hall (6'9, 230, Sr.)6.20.3120.4 MPG, 6.2 PPG (58% 2PT, 71% FT), 4.4 RPG, 1.4 TOPG
Skylar McBee (6'3, 195, Sr.)3.60.1425.1 MPG, 5.6 PPG (27% 2PT, 33% 3PT, 84% FT)
Derek Reese (6'8, 208, Fr.)3.60.2613.6 MPG, 3.7 PPG (50% 2PT, 32% 3PT, 67% FT), 2.1 RPG
Armani Moore (6'5, 203, Fr.)2.50.1913.1 MPG, 2.4 PPG (40% 2PT, 36% 3PT, 58% FT), 2.5 RPG
Yemi Makanjuola (6'9, 250, So.)1.40.187.9 MPG, 1.7 PPG, 2.4 RPG
D'Montre Edwards (6'6, 206, Jr.)1.20.158.0 MPG, 2.5 PPG, 1.8 RPG
Quinton Chievous (6'5, 201, RSFr.)1.00.109.6 MPG, 1.8 PPG, 2.1 RPG

* AdjGS = a take-off of the Game Score metric (definition here) accepted by a lot of basketball stat nerds. It redistributes a team's points based not only on points scored, but also by giving credit for assists, rebounds (offensive & defensive), steals, blocks, turnovers and fouls. It is a stat intended to determine who had the biggest overall impact on the game itself, instead of just how many balls a player put through a basket.

  • Highest Usage%: McRae (27%), Stokes (25%), Golden (25%)
  • Highest Floor%: Stokes (41%), Golden (41%), Hall (41%)
  • Highest %Pass: Golden (60%), Moore (52%), Richardson (46%)
  • Highest %Shoot: McBee (53%), Reese (49%), Hall (44%)
  • Highest %Fouled: Stokes (23%), Hall (21%), McRae (13%)
  • Highest %T/O: Hall (15%), Moore (13%), Richardson (10%)
  • The roles on this team are pretty clear. Jordan McRae takes the shots, Jarnell Stokes grabs the misses, Trae Golden makes the passes, Skylar McBee fills in the gaps (a little passing, some open 3's, some defense, few mistakes), Josh Richardson runs around and jumps a lot, and the bench players hit the glass. This is oversimplified, of course, but ... that's pretty much it. If you can disrupt this lineup with foul trouble, the Vols will struggle. But they're a lot better at drawing fouls from you than you are at drawing fouls from them.

Keys to the Game

  1. The Glass. I'm not sure rebounding has been more important to a single game this year. If Tennessee is grabbing rebounds, especially on the offensive end, then that pretty much confirms that they are also drawing fouls, getting points at the line, and softening up Mizzou's lineup on the interior. If Alex Oriakhi can both hit the defensive glass like he has of late (he has a 25% defensive rebounding rate in the last six games, which would be a Top 30 average for the entire season), and if Tony Criswell (21% in the last six games), Earnest Ross (16%), and Keion Bell (14%) can continue to pitch in (strangely, Laurence Bowers has only been at 10% in the last six), then the path to victory is pretty obvious. But if Tennessee is grabbing second chances, drawing fouls from Oriakhi and others, and ensuring that Frank Haith has to play players like Criswell and Ryan Rosburg more, then Mizzou's optimal lineup is not on the court, and the advantage shifts to Tennessee.

  2. Flipadelphia. It's a road game, which means all eyes are on Phil Pressey, and for all the reasons to which we've grown accustomed. If he's under control, finding open shooters, making that little tear-dropper in the lane, and playing reasonably acceptable defense (i.e. the opponent's point guard isn't going off, as has happened many times this year), then Mizzou is the better team.

  3. Slap the Floor. We saw against Arkansas and Florida just how well this team can play defense when the motivation is dialed up. (Yes, Arkansas got a lot of the same shots as South Carolina and LSU and just missed them; still, the defensive intensity was dramatically higher, and for a more sustained period of time.) Tennessee is not a good shooting team; don't let them find open shots. Don't let them find their rhythm. Force them to rebound against a great defensive rebounding Mizzou lineup. Hold them to fewer than 1.0 points per possession, or, hell, even 1.05, and you probably win.

Prediction

Pomeroy says Mizzou 72, Tennessee 69. That sounds about right, but honestly, in Knoxville, against an opponent that plays a home-friendly style and is desperate for a win, I lean toward picking the Vols. I'll say UT 77, MU 75, acknowledging that if Mizzou shows up on the defensive end, the Tigers can make me feel pretty stupid about that one.

2013 Akron football's 10 things to know: Bad breaks and long roads

$
0
0
20120908_jrc_bm1_435

Confused? Check out the glossary here.

1. Terry Bowden is taking the long way

There are a few different ways to build talent when you take over a program that has fallen on hard times. (And when you go 3-33 over a three-year span, I figure that probably qualifies as "hard times.") You can load up on junior college transfers, hoping the immediate boost they provide can carry you to both success and the ability to sign better four-year players a couple of years down the road. You can load up on transfers from other schools, hoping for the same thing. Or you can simply sign classes of mostly four-year talent, hoping that the short-term pain (and unlikely immediate success) is mitigated by the long-term pluses of steady program building.

All three of these options have pros and cons, of course. With transfers (junior college and otherwise), you are banking on their ability to become quickly assimilated into your program. You're also banking on your talent identification skills; a class of failed junior college transfers can doom you both by ensuring a bad product and by ensuring that, come Year 3, you have very little "third year in the system" talent. Meanwhile, by signing mostly freshmen, you're waiting.

With the reputation he built at North Alabama (where he was known for taking many a Division I transfer), one would probably have assumed that second-year Akron head coach Terry Bowden would have gone with either Option 1, Option 2, or a combination thereof. But while Akron's best first-year player was indeed a transfer (quarterback Dalton Williams came to Akron from Stephen F. Austin on a fifth-year, no-wait transfer), early returns are that Bowden is actually electing to take the long way. While we may learn of more fifth-year transfers in the next couple of months, it doesn't appear that there are any in the pipeline just yet. And of the 39 players he has signed on National Signing Day in the last two years, only five have come from junior colleges.

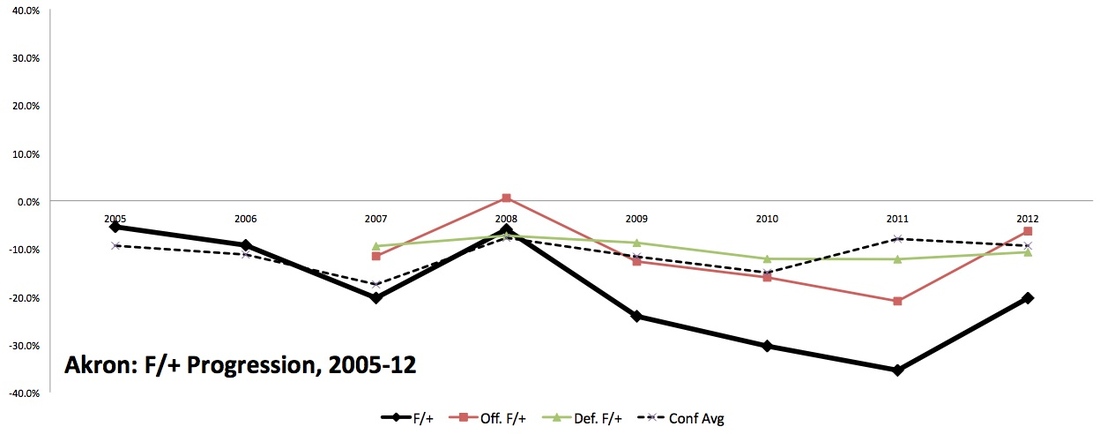
Thanks to some transfers away from Akron last year, the 2012 Zips squad was exceedingly young; but they improved regardless, at least on offense, and while close losses kept the record from improving, this was probably Akron's best team since 2008. Depth should be much stronger in 2013, though the quarterback position will probably determine whether we see much improvement in the win total.

2012 Schedule & Results

Record: 1-11 | Adj. Record: 2-10 | Final F/+ Rk: 109
DateOpponentScoreW-LAdj. ScoreAdj. W-L
30-AugCentral Florida14-56L18.5 - 29.8L
8-Sepat Florida International38-41L21.1 - 28.1L
15-SepMorgan State66-6W31.6 - 17.9W
22-Sepat Tennessee26-47L16.1 - 31.8L
29-SepMiami (Ohio)49-56L44.8 - 48.8L
6-OctBowling Green10-24L25.2 - 37.5L
13-Octat Ohio28-34L29.2 - 29.0W
20-OctNorthern Illinois7-37L14.4 - 27.4L
27-Octat Central Michigan14-35L26.6 - 29.3L
3-Novat Kent State24-35L31.4 - 33.0L
10-NovMassachusetts14-22L21.7 - 36.6L
20-Novat Toledo23-35L15.9 - 32.1L
CategoryOffenseRkDefenseRk
Points Per Game26.17935.7106
Adj. Points Per Game24.79431.895

2. Bad turnover luck = bad close-game record

The Akron defense defensed just 38 passes; only 11 FBS had a lower total than that. But they also recorded only five interceptions. On average, 20-25 of your passes defensed are interceptions, so a combination of stone hands and bad luck cost the Zips about four takeaways. Meanwhile, they recovered just 38 percent of all fumbles. In all, bad luck cost them in the neighborhood of eight to 10 turnovers, and three or four points, per game. It probably makes sense, then, that Akron went 0-4 in one-possession games. The Zips were at least slightly unlucky in all four of those games, though the coup de grace was the loss to UMass; UMass defensed seven Akron passes but picked off four of them (two deep in Akron territory) and returned them for a combined 80 yards.

Of course, Akron lost 11 games, and we can really only ascribe luck to four of them. The Zips lost the other seven games by an average score of 38.4 to 16.9. The steps forward were undeniable, but there obviously still a few steps left to take.

Offense

CategoryYards/
Game Rk
S&P+ RkSuccess
Rt. Rk
PPP+ Rk
OVERALL4510885115
RUSHING10810786112
PASSING1610376109
Standard Downs9974107
Passing Downs110103114
Redzone10097104
Q1 Rk671st Down Rk86
Q2 Rk722nd Down Rk118
Q3 Rk1163rd Down Rk79
Q4 Rk112

3. Akron's new offensive coordinator is 26 years old

Head coach Terry Bowden is an offense guy. We've known that for a while. His first four Auburn teams (1993-96) all averaged at least 30 points per game. His first North Alabama team averaged 39. He ran the show for Akron's offense last fall, and the impact was clear; Akron's 26.1 points per game in 2012 were its second-highest average since 2003.

In 2013, however, with defense and special teams still in need of serious attention, Bowden is doing a little bit of delegation. He promoted A.J. Milwee, former North Alabama quarterback, to the role of offensive coordinator in December. There's a very good chance that Milwee is younger than you are. And while I'm not going to do any research to prove this for sure, let's just say that you probably aren't going to find two coordinators with a wider age range than Milwee and defensive coordinator Chuck Amato (though Utah's Brian Johnson and Dennis Erickson come close); at 66, Amato is more than twice Milwee's age, which is pretty fantastic.

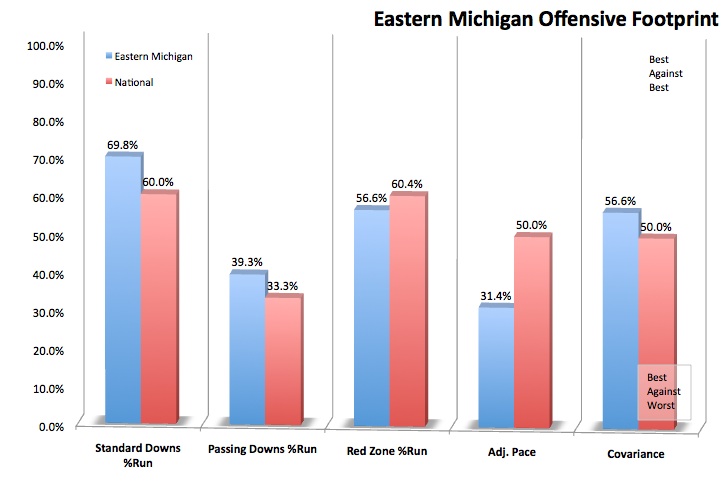
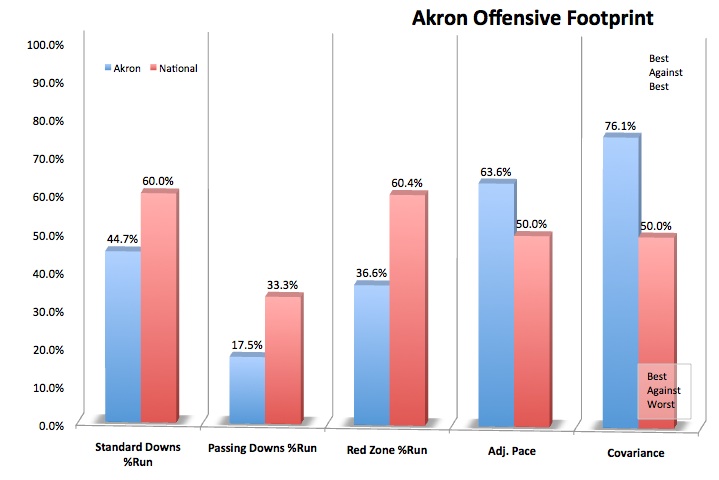
4. Wanted: big plays

As you see above, Akron's efficiency ratings (Success Rate) were pretty consistently higher than their explosiveness ratings (PPP+), especially on standard downs. The Zips were rather tactically successful, and in quarterback Dalton Williams, running back Jawon Chisholm and receiver Marquelo Suel, they had three players capable of carrying the load and moving the chains. But big plays were a rarity, to say the least. You can coach your way to first downs, but you need play-makers to score points, and Akron wasn't quite there yet. And now they must deal with replacing both Williams and and Suel.

Kyle Pohl, Williams' most likely replacement, was perfectly efficient in the competitive, season-ending loss to Toledo. He completed two-thirds of his passes (28 of 42) and threw two touchdown passes, though only two passes were of any notable distance (overall: 7.6 yards per completion), and he was sacked four times. It is hard to say who might have a good chance at the job other than Pohl, though, so he better work out.

Suel, meanwhile, was far from a big-play threat, but his 75 percent catch rate was outstanding; he was a reliable option on both standard and passing downs, and his consistency could be missed. Aside from perhaps senior Jerod Dillard, nobody else in this receiving corps provided any major big-play ability either, but at the very least the experience level here is strong. The quarterback, be it Pohl or somebody else, will have at his disposal a unit deep with options (none of which are amazing, all of which are decent) and players who are now in their second year in this system.

Quarterback

Note: players in bold below are 2013 returnees. Players in italics are questionable with injury/suspension.

PlayerHt, Wt2013
Year
RivalsCompAttYardsComp
Rate
TDINTSacksSack Rate Yards/
Att.
Dalton Williams3265223,38762.5%2516193.5%6.0
Kyle Pohl 6'3, 206 So. *** (5.5) 38 58 366 65.5% 5 2 3 4.9% 5.6
Thomas Woodson 6'2, 190 Fr. ** (5.4)


Running Back

PlayerPos.Ht, Wt2013
Year
RivalsRushesYardsYards/
Carry
Hlt Yds/
Carry
TDAdj.
POE
Jawon ChisholmRB6'1, 190Jr.** (5.1) 180 953 5.3 4.9 5 -5.9
Conor HundleyRB5'10, 203So.** (5.3) 73 279 3.8 2.9 3 -10.3
Quentin HinesRB351945.59.61+1.5
Hakeem LawrenceFB5'7, 164So.** (5.4) 22 82 3.7 2.3 0 -3.9
Dalton WilliamsQB10212.14.60-2.1
Kyle PohlQB6'3, 206So. 8 49 6.1 2.2 0 +0.3
Wade EdwardsRB5'8, 170RSFr.** (5.3)


Manny MorganRB5'8, 180Fr.** (5.4)


Anthony LauroRB5'10, 190Fr.** (5.4)


Receiving Corps

PlayerPos.Ht, Wt2013
Year
RivalsTargetsCatchesYardsCatch RateYds/
Target
Target
Rate
%SDReal Yds/
Target
RYPR
Marquelo SuelWR-Y1027682074.5%8.018.7%58.8%8.082.7
L.T. SmithWR-Z6'0, 197Jr.** (5.3) 77 48 509 62.3% 6.6 14.1% 63.6% 6.6 51.3
Dee FriesonWR-H5'8, 181Sr.** (5.2) 70 48 400 68.6% 5.7 12.8% 68.6% 5.6 40.3
Keith SconiersWR-X6'0, 171Sr.*** (5.6) 55 41 479 74.5% 8.7 10.1% 61.8% 8.8 48.3
Jawon ChisholmRB6'1, 190Jr.** (5.1) 54 38 310 70.4% 5.7 9.9% 61.1% 5.7 31.3
Jerrod DillardWR-X6'5, 199Sr.** (5.2) 47 29 401 61.7% 8.5 8.6% 59.6% 8.5 40.4
Imani DavisWR-H5'9, 165So.** (5.4) 32 14 99 43.8% 3.1 5.9% 65.6% 3.1 10.0
Zach D'OrazioWR6'2, 201So.** (5.2) 20 15 197 75.0% 9.9 3.7% 70.0% 9.8 19.9
Andrew PrattWR-Z6'5, 205So.** (5.2) 20 10 156 50.0% 7.8 3.7% 40.0% 8.9 15.7
Tyrell GoodmanWR-X6'2, 198So.** (5.2) 19 14 113 73.7% 5.9 3.5% 63.2% 6.1 11.4
Tyler WilliamsWR-Y5'7, 145Jr.*** (5.5) 19 11 110 57.9% 5.8 3.5% 36.8% 3.8 11.1
Quentin HinesRB975477.8%6.01.6%55.6%5.95.4
Conor HundleyRB5'10, 203So.** (5.3) 7 5 59 71.4% 8.4 1.3% 42.9% 8.3 5.9
Nolan ProcterWR5'8, 160Sr.** (5.2) 4 1 6 25.0% 1.5 0.7% 0.0% 0.8 0.6
Dylan PottsWR5'11, 190Sr.** (5.2) 4 2 2 50.0% 0.5 0.7% 50.0% 0.6 0.2
Will FlemingTE6'4, 230Sr.*** (5.5) 3 2 8 66.7% 2.7 0.5% 100.0% 1.6 0.8

Offensive Line

CategoryAdj.
Line Yds
Std.
Downs
LY/carry
Pass.
Downs
LY/carry
Opp.
Rate
Power
Success
Rate
Stuff
Rate
Adj.
Sack Rate
Std.
Downs
Sack Rt.
Pass.
Downs
Sack Rt.
Team 86.7 2.961.9537.3%66.7%20.8% 118.6 3.0%4.8%
Rank 108 64122796292 44 3236
PlayerPos.Ht, Wt 2013
Year
RivalsCareer Starts/Honors/Notes
Mitch StraightRG28 career starts
Adam BiceRT22 career starts
Travis SwitzerC6'2, 280Jr.** (5.3)15 career starts
Jarrod PughsleyLG6'5, 291Sr.NR11 career starts
Vinnie RizzoC10 career starts
Dylan BrumbaughLG6'5, 287So.** (5.4)4 career starts
Quaison OsborneLT6'3, 290So.** (5.2)3 career starts
Micah LioRG6'8, 308Jr.** (5.2)
Joe PetridesRT
Andrew BohanLG6'3, 262So.** (5.4)
Michael CasimosOL6'2, 271RSFr.** (5.4)
Cedric BrittnumOL6'5, 315Jr.** (5.2)
Stephen EricksonOL6'4, 275Fr.** (5.4)

5. Akron's offensive line was downright solid in 2012

A quick passing game might not lead to many big plays, but it helps to diffuse the opposing pass rush and avoid sacks. As a result, Akron's sack rates were perfectly acceptable last season, and it might not have had much to do with the offensive line. But the line was pretty good at converting short yardage and was decent at creating opportunities for Jawon Chisholm and company. That says good things about its overall proficiency, though if the primary reasons for this decent play were guard Mitch Straight and tackle Adam Bice, that could be a problem. These two, along with center Vinnie Rizzo, have run out of eligibility, taking their 60 career starts with them. Akron does return four players with starting experience, including two sophomores, but there is a good chance that the line won't be quite as reliable in 2013. That's never what you want to hear when you've got a new starting quarterback, though again, Bowden and Milwee will give the QB quite a few easy, quick passes to throw.

Defense

CategoryYards/
Game Rk
S&P+ RkSuccess
Rt. Rk
PPP+ Rk
OVERALL101111115104
RUSHING1119998100
PASSING71112118109
Standard Downs110114104
Passing Downs10191101
Redzone9992102
Q1 Rk1041st Down Rk107
Q2 Rk902nd Down Rk102
Q3 Rk1043rd Down Rk85
Q4 Rk109

6. The Akron defense was incredibly, ridiculously small last year

In Akron's final depth chart of 2012, the Zips produced one of the smallest defensive two-deeps you will ever see at the FBS level.

Average size of defensive ends on final two-deep of 2012: 6'2, 229
Average size of defensive tackles: 6'1, 272
Average size of linebackers: 6'1, 215
Average size of cornerbacks: 5'11, 183
Average size of safeties: 5'10, 191

So basically, Akron's tackles were smaller than the average 3-4 end at the major conference level, the Zips' ends were essentially regular-sized linebackers, and their linebackers were basically big safeties. You can survive like this if you've got speed and experience -- Northern Illinois' defense really wasn't much bigger than this -- but Akron had little of either in 2012. And while the offene improved dramatically in Bowden's first season, the defense performed at basically the same level as 2010-11. Or, to put it another way, the defense was still pretty bad.

This year, Akron could see quite a few newcomers in the rotation. Three-star junior college transfer Keontae Hollis could make for a nice (if still undersized) tackle combo with sophomore Cody Grice (7.5 tackles for loss), junior college transfer Jon Shelby and three-star freshman Jerome Lane could provide some play-making ability and depth in the linebacking corps (a unit that lacked both last year), and an experienced, semi-interesting secondary welcomes junior college transfer Donte Williams to the mix, as well. The defense won't be much bigger this fall, but one can see how a deeper, and perhaps marginally more talented two-deep could give Amato a few more buttons to press.

Defensive Line

CategoryAdj.
Line Yds
Std.
Downs
LY/carry
Pass.
Downs
LY/carry
Opp.
Rate
Power
Success
Rate
Stuff
Rate
Adj.
Sack Rate
Std.
Downs
Sack Rt.
Pass.
Downs
Sack Rt.
Team 94.1 2.993.2141.1%58.0%21.6% 75.0 2.5%6.0%
Rank 82 7460891036 101 11271
NamePosHt, Wt2013
Year
RivalsGPTackles% of TeamTFLSacksIntPBUFFFR
Cody GriceNG5'11, 272So.** (5.4) 12 36.0 5.0% 7.5 0 0 0 0 0
J.D. GriggsDE1235.55.0%1161300
Albert PresleyDE6'2, 226Sr.NR 7 23.0 3.2% 8 2 0 1 1 0
Nico CaponiDT6'3, 270Sr.** (5.3) 9 23.0 3.2% 3 2 0 1 0 0
Alfonso HornerDE6'3, 200So.** (5.3) 12 19.5 2.7% 2 1.5 0 1 0 0
Isaiah WilliamsDT6'3, 264Jr.** (5.2) 11 8.5 1.2% 0 0 0 0 0 0
Jamel TurnerDE6'3, 215So.**** (5.8) 9 6.5 0.9% 3.5 2 0 0 0 0
Mike DavisNG6'0, 280So.NR 5 2.5 0.3% 0 0 0 0 0 0
Varnell GarrettDE6'3, 223Jr.NR 2 1.0 0.1% 1 1 0 0 0 0
Austin BaileyDE5'11, 247Sr.** (5.4)

James PriceNG6'0, 305So.** (5.2)

Keontae HollisDT6'2, 285Jr.*** (5.5)


Linebackers

NamePosHt, Wt2013
Year
RivalsGPTackles% of TeamTFLSacksIntPBUFFFR
Kurt MangumMIKE1279.011.0%511111
Troy GilmerWILL1255.57.8%400301
Justin MarchSAM6'0, 203Jr.*** (5.5) 11 48.5 6.8% 2 0 1 3 0 0
Dylan EvansSAM6'2, 191So.** (5.2) 10 18.5 2.6% 0 0 0 0 0 0
Jatavis BrownWILL5'11, 203So.** (5.2) 11 18.0 2.5% 0.5 0 0 0 1 0
Gary RansomMIKE5'11, 215Jr.NR 9 11.0 1.5% 0 0 0 0 1 0
Nick RossiLB6'0, 217Jr.*** (5.6) 12 7.0 1.0% 0.5 0 0 0 0 1
Conor SeemanMIKE6'3, 227Sr.NR 10 3.0 0.4% 0 0 0 0 0 0
Keionne BainesLB5'11, 226RSFr.** (5.3)

John RachalLB6'2, 206RSFr.** (5.3)

Jon ShelbyLB6'1, 210Jr.** (5.2)

Jerome LaneLB6'3, 203Fr.*** (5.5)


Secondary

NamePosHt, Wt2013
Year
RivalsGPTackles% of TeamTFLSacksIntPBUFFFR
Johnny RobinsonS5'9, 184Jr.** (5.2) 12 51.0 7.1% 2 0 0 1 1 0
Malachi FreemanCB5'9, 174Sr.NR 12 47.5 6.6% 2.5 0 0 7 0 0
Anthony HolmesS6'0, 192Sr.*** (5.5) 10 41.0 5.7% 1 0 0 2 0 0
Avis CommackCB1234.54.8%101300
Bre' FordS5'10, 204Jr.** (5.3) 12 27.5 3.8% 3 0 0 1 1 1
Bill AlexanderCB5'8, 170Sr.*** (5.5) 8 19.0 2.7% 0 0 0 1 0 0
Devonte MorganS5'10, 185Jr.** (5.2) 9 18.5 2.6% 0 0 0 0 0 0
Micklos BlakeCB1217.52.4%0.50.50301
Josh RichmondS915.02.1%001000
Bryce CheekCB6'0, 184So.** (5.4) 8 7.0 1.0% 0 0 0 0 0 0
Seth CunninghamCB6'0, 181Sr.** (5.4) 9 7.0 1.0% 0 0 0 1 0 0
John SenterCB5'10, 160So.NR 6 3.5 0.5% 0 0 0 0 0 0
Martel DurantCB5'10, 167Jr.NR 7 1.5 0.2% 0 0 0 0 0 0
Sean GravesS5'11, 177Sr.NR 10 1.5 0.2% 0 0 0 0 0 0
Donte WilliamsDB5'10, 180Jr.** (5.2)


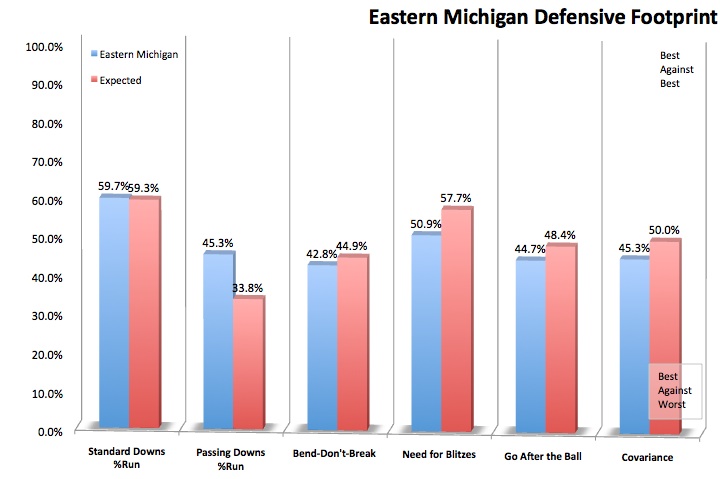
7. Aggression looks good on you

The line was decent to solid against the run (Akron actually stood up to short-yardage situations quite well and made some plays behind the line of scrimmage) and should be again, but the already-iffy pass rush will be hurt by the loss of end J.D. Griggs, probably meaning another year of general passivity from the secondary. But if Amato can unearth just one or two more play-makers, the ceiling for this defense could be reasonably high.

In players like tackle Cody Grice, linebacker Justin March (two tackles for loss, three passes broken up), corner Malachi Freeman (2.5 tackles for loss, seven passes broken up) and safeties Johnny Robinson, Anthony Holmes and Bre' Ford (combined: six tackles for loss, four passes broken up), Amato had some players he didn't mind sending into attack mode. But with limited ability elsewhere, he still had to be pretty cautious. Aggression looks good in blue and gold, but it might be another year before Amato can attack as much as he wants.

Special Teams

PunterHt, Wt2013
Year
PuntsAvgTBFCI20FC/I20
Ratio
Zach Paul6'3, 218So. 65 40.9 4 11 18 44.6%
KickerHt, Wt2013
Year
KickoffsAvgTBTB%
Zach Paul6'3, 218So. 35 59.3 15 42.9%
Robert Stein5'8, 164So. 24 49.7 6 25.0%
Place-KickerHt, Wt2013
Year
PATFG
(0-39)
PctFG
(40+)
Pct
Robert Stein5'8, 164So. 38-39 6-8 75.0% 3-4 75.0%
ReturnerPos.Ht, Wt2013
Year
ReturnsAvg.TD
Imani DavisKR5'9, 165So. 13 19.3 0
Tyler WilliamsKR5'7, 145Jr. 12 14.9 0
Imani DavisPR5'9, 165So. 19 8.8 0
Dee FriesonPR5'8, 181Sr. 5 -0.6 0
CategoryRk
Special Teams F/+116
Net Punting116
Net Kickoffs80
Touchback Pct63
Field Goal Pct45
Kick Returns Avg123
Punt Returns Avg83

8. Special teams are a great equalizer (for teams not named Akron)

Robert Stein is a solid kicker, Zach Paul was pretty good at booting touchbacks on kickoffs, and in general Akron covered well on kickoffs. So there's that. But elsewhere the special teams unit was lacking. There was no return man worth writing home about (not that anybody "writes home" anymore), and if Paul couldn't induce a fair catch on a punt, the return man was probably running a long way. Akron was unable to leverage field position in its favor, and it goes without saying that this needs to change in 2013.

2013 Schedule & Projection Factors

2012 Schedule
DateOpponentProj. Rk
29-Augat Central Florida54
7-SepJames MadisonNR
14-Sepat Michigan22
21-SepUL-Lafayette78
28-Sepat Bowling Green67
5-OctOhio83
12-Octat Northern Illinois50
19-Octat Miami (Ohio)106
26-OctBall State84
2-NovKent State80
16-Novat Massachusetts124
29-NovToledo62
Five-Year F/+ Rk117
Two-Year Recruiting Rk118
TO Margin/Adj. TO Margin*-14 / -4.0
TO Luck/Game-4.2
Approx. Ret. Starters (Off. / Def.)14 (7, 7)
Yds/Pt Margin**+3.8

9. You've got to start somewhere

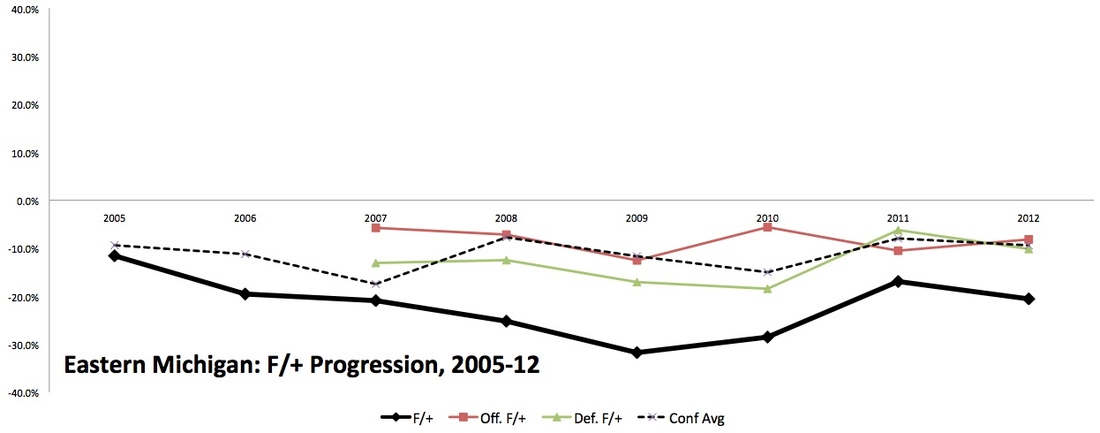
Akron improved a solid amount in 2012, from 117th in the F/+ rankings in 2010 and 118th in 2011 to 109th. The offense was easily Akron's best since 2008, and even the defense's overall ranking improved slightly (from 108th to 105th). The Zips were a few good breaks from potentially finishing 3-9, 4-8 or even 5-7. But they didn't. Improvement on paper is fine, but improvement in the win column is the only thing that ends up mattering. Between luck, a lack of big plays, and poor special teams, Akron won just a single game for the third straight year. And with new talent needed atop the depth chart at quarterback, receiver, offensive line, and linebacker, there's nothing guaranteeing that the Zips will be too much better in 2013.

Still, improvement is improvement. For the first time in 3-4 years, Akron looked like it might be going somewhere last fall. The Zips play host to five teams projected 78th or worse in 2013, and road trips to Miami (Ohio) and UMass are in no way guaranteed losses. If Bowden can find a couple more interesting pieces, either via redshirt, the 2013 recruiting class, or an impending transfer, this team could threaten to win at least 3-5 games. Bowl eligibility is a bit too much to aim for, but when you've won three games in three years, winning three in a season would be pretty clear, definable improvement. So let's start there.

10. Akron won a MAC title eight years ago

Akron does, by the way, play in the MAC, perhaps the most parity-happy league in the country. The Zips came out of nowhere to win the MAC in 2005, Buffalo did the same in 2008, and in the midst of a four-decade bowl drought, Kent State surged to the doorstep of a BCS bowl in 2012. Turnarounds can happen pretty quickly in this league, and while 2013 probably won't be amazing for Akron, it certainly bears mentioning that Terry Bowden might not have to wait too much longer to make waves.

More in College Football:

SB Nation exclusive with Bobby Petrino, football mind

The 10 least powerful people in college football

Bracketology: Spencer Hall's Carnival of Stupidity

This Alabama tattoo will haunt your dreams

All in, at last: SB Nation inside Gus Malzahn's Auburn

The speed conspiracy: Comparing NFL and high school 40-yard dash times

QBs and completion percentages: Frequently Asked Questions

$
0
0
20130222_mje_ss1_167

The response to last week's piece about quarterbacks, adjusted completion percentage, etc., was a bit overwhelming, both because of the volume of responses (comments, Twitter responses, emails) and the fact that I was traveling when the responses rolled in. So I figured I'd just compile responses into one piece. Seemed easier.

Below are questions I received from any number of sources.

Alabama has a surprising number of short passes, do you have any sense how many of those are checkdowns/screens vs. designed short passes?

We don't have a perfect way to answer this question ("checkdown" isn't an option in the dropdown, though perhaps it should be), but here are some details regarding the 122 A.J. McCarron passes that traveled fewer than five yards:

  • 79 came out of a shotgun formation (64.8%), 35 were from under center (28.7%), and seven were from the pistol (5.7%).
  • 25 targeted Eddie Lacey (20.5%), 19 targeted Amari Cooper (15.6%), 14 targeted Christion Jones (11.5%), 14 targeted Michael Williams (11.5%), 11 targeted Kevin Norwood (9.0%), 10 targeted T.J. Yeldon (8.2%), nine targeted Cyrus Jones (7.4%), and five targeted Kenny Bell (4.1%). That's balance.
  • 18 were halfback screens (14.8%), 14 were receiver screens (11.5%), 12 were bootlegs/rollouts (9.8%), eight were bubble screens (6.6%), and two were screen passes (1.6%).
  • Three were throwaways (2.5%).
  • Two were tipped at the line (1.6%).

Yeah, Johnny Manziel's completion percentages in our sample were average or below average on all throws beyond 20 yards (30% from 20-24 yards, 46% from 25-29, 17% from 30-34, 40% from 35-39, 0% from 40+). If he can borrow Geno Smith's deep ball, his numbers would be unfathomable.

Can't dispute the truth. I withdraw any comments I made about Collin Klein being underrated.

Well, I'd say "ruins" is a bit overstated, yes? The comparison would be better with more stats, but we did what we could with two interns. I'm taking volunteers for next year; we could do amazing things with broader data.

As a Husker fan, should I be more encouraged or less encouraged by this data...

Yes.

(Seriously, this reaffirms how well Tim Beck did at play-calling. With a quarterback who is woefully inaccurate after 10 yards, he crafted one of the most effective standard downs offenses in the country around easy, short passes and a lovely running game. Opponents couldn't completely gang up on the run because Martinez would complete an easy 8-yarder on first down.)

Yeah, you don't need stats to back up your impressions of that one.

Tevin Washington. Where the crap is he?

Did he even throw a pass last year?

Chelf was Ok St’s THIRD option at QB. That system has to be the definition of plug-and-play offense.

Right???

Here's a breakout:

  • <5 yards: 72% from under center, 72% from shotgun
  • 5-14 yards: 63% from under center, 59% from shotgun
  • 15-24 yards: 63% from under center, 50% from shotgun (tiny sample)
  • 25+ yards: 47% from under center, 0% from shotgun (tiny sample)

Pretty inconclusive overall. Barkley was just slightly worse from the shotgun on passes under 15 yards, and we didn't have enough charted shotgun passes to get a sample of passes over 15 yards.

Though Ryan Nassib and Tyler Bray also looked pretty awful in my sample, Barkley is probably the quarterback whose stats and perceptions were the most disparate (at least in a negative sense). I actually struggle with this a bit because I've always enjoyed watching Barkley. For a golden-boy, glamour quarterback, he has always seemed to have a really good head on his shoulders, he's great in interviews, his mechanics are pretty and old-school, and he really seems to want to be a leader.

And for what it's worth, his numbers on the longer throws were somewhere between average and downright strong. But a) you have to make shorter throws, too (otherwise Jeff George would be in the NFL Hall of Fame), and b) while it seems like he's a pretty good leader, it's really hard for me to ignore that this year's USC team appeared completely lacking in leadership in 2012. Obviously Barkley didn't play defense, so we cannot pin the Trojans' occasional struggles on that side of the ball on him. But even the offense spent good chunks of the season underachieving, just like it did in 2011 and in every season in which he was the starting quarterback. The ceiling for Barkley, with the composure and the longer throws, is probably pretty high. But the floor is low. Really low. And picking him too high would place expectations on him that I don't think he'd have much of a chance to meet. Maybe I'm wrong, but the numbers backed up what I perceived when I watched him play in 2012. With the best receiving corps on the West Coast and a (theoretical) offensive wiz calling plays, Barkley and the USC offense were only occasionally strong. They finished the year ranked 33rd in Off. F/+, and while part of that can be ascribed to the egg the Trojans laid in the bowl game without Barkley ... only part of it can. South Carolina ranked 28th, for goodness' sakes, and they had two quarterbacks and spent half the year without their star running back.

What games did you chart?

I thought I had shared that, but I had not. Here's the list of 109 games. I recommend a Ctrl-F search to find your team's games.

DateAwayHome
8/30Washington StateBYU
9/1MichiganAlabama
9/1North TexasLSU
9/1Arkansas StateOregon
9/1San Diego StateWashington
9/1MarshallWest Virginia
9/8Western KentuckyAlabama
9/8WashingtonLSU
9/8AuburnMississippi State
9/8DukeStanford
9/8USCSyracuse
9/8FloridaTexas A&M
9/8Eastern WashingtonWashington State
9/15AlabamaArkansas
9/15Wake ForestFlorida State
9/15Notre DameMichigan State
9/15CaliforniaOhio State
9/15USCStanford
9/15FloridaTennessee
9/21BaylorUL-Monroe
9/22LSUAuburn
9/22ClemsonFlorida State
9/22ArizonaOregon
9/22ColoradoWashington State
9/22MarylandWest Virginia
9/29Ole MissAlabama
9/29Oregon StateArizona
9/29TennesseeGeorgia
9/29Ohio StateMichigan State
9/29WisconsinNebraska
9/29BaylorWest Virginia
10/6LSUFlorida
10/6Miami-FLNotre Dame
10/6Washington StateOregon State
10/6GeorgiaSouth Carolina
10/6West VirginiaTexas
10/6OklahomaTexas Tech
10/6OregonWashington State
10/13Texas A&MLouisiana Tech
10/13South CarolinaLSU
10/13AlabamaMissouri
10/13StanfordNotre Dame
10/13OklahomaTexas
10/18OregonArizona State
10/20South CarolinaFlorida
10/20Florida StateMiami-FL
10/20UtahOregon State
10/20AlabamaTennessee
10/20LSUTexas A&M
10/20Kansas StateWest Virginia
10/27Mississippi StateAlabama
10/27USCArizona
10/27Texas A&MAuburn
10/27FloridaGeorgia
10/27Texas TechKansas State
10/27Washington StateStanford
11/3Ole MissGeorgia
11/3Oklahoma StateKansas State
11/3AlabamaLSU
11/3Texas A&MMississippi State
11/3OregonUSC
11/3Washington StateUtah
11/3TCUWest Virginia
11/10Texas A&MAlabama
11/10OregonCalifornia
11/10Mississippi StateLSU
11/10Fresno StateNevada
11/17Kansas StateBaylor
11/17Ole MissLSU
11/17StanfordOregon
11/17USCUCLA
11/17OklahomaWest Virginia
11/24AuburnAlabama
11/24South CarolinaClemson
11/24FloridaFlorida State
11/24Georgia TechGeorgia
11/24MichiganOhio State
11/24OregonOregon State
11/24StanfordUCLA
11/24Notre DameUSC
11/29LouisvilleRutgers
11/30Northern IllinoisKent State
11/30UCLAStanford
12/1AlabamaGeorgia
12/1Florida StateGeorgia Tech
12/1TexasKansas State
12/1Central FloridaTulsa
12/1NebraskaWisconsin
12/15NevadaArizona
12/15ToledoUtah State
12/20San Diego StateBYU
12/22WashingtonBoise State
12/22East CarolinaUL-Lafayette
12/24Fresno StateSMU
12/27San Jose StateBowling Green
12/28OhioUL-Monroe
12/29NavyArizona State
12/29TCUMichigan State
12/29SyracuseWest Virginia
12/31LSUClemson
12/31USCGeorgia Tech
1/1GeorgiaNebraska
1/1Mississippi StateNorthwestern
1/1Oklahoma StatePurdue
1/1WisconsinStanford
1/2LouisvilleFlorida
1/3OregonKansas State
1/4OklahomaTexas A&M
1/7AlabamaNotre Dame

Stats, LLC, does great things with it, and I'm really hoping that it catches on at this level. It just provides such wonderful depth and context. With SBN's help, I will be pushing to expand our charting reach (with help from volunteers) this coming fall. And yeah, if it were to somehow catch on at the high school level ... man ... you want to talk about improved prospect scouting? It would be fantastic and provide so much more context than watching studs run drills or embarrass overwhelmed opponents.

This is some really exciting stuff- Bill, is there any plan to crowdsource/share/open-source all of this data?

That's certainly the goal at some point. Stay tuned.

Saturday live thread

$
0
0
Rooting_guide_1

So basically, slightly better things happen for Missouri if LSU beats Ole Miss. So let's root for that.

11:00 a.m. CT
ATLANTIC SUN FINALS: Florida Gulf Coast vs. Mercer (ESPN2)
No. 11 Florida at Kentucky (CBS)
No. 17 Syracuse at No. 5 Georgetown (ESPN)
UAB at No. 25 Memphis (CBS Sports)

12:30 p.m. CT
Ole Miss at LSU (ESPN3)
South Carolina at Vanderbilt
No. 9 Kansas State at No. 13 Oklahoma State
La Salle at No. 16 Saint Louis (NBC Sports)

1:00 p.m. CT
Texas A&M at Arkansas (ESPNU)
No. 23 UCLA at Washington (CBS)
No. 15 Marquette at St. John's (ESPN)

1:30 p.m. CT
No. 19 Oregon at Utah (Pac-12)


Basketball live thread: Missouri at Tennessee

$
0
0
20130228_ajw_ay3_275

What: Mizzou Basketball
Who: Missouri Tigers (22-8) at Tennessee Volunteers (18-11)
When: 3:00 p.m. CT
Where: Thompson-Boling Arena (21,678)


TV: ESPN (Mark Jones, Jimmy Dykes)
Radio: Tiger Radio Network (Mike Kelly, Linker Link)


With a win in Knoxville, Missouri clinches the third seed in the SEC Tournament. With a loss, the Tigers are either fourth, fifth or (most likely) sixth. So, uh, how about a win then?


M-I-Z...
What: Mizzou Basketball
Who: Missouri Tigers (22-8) at Tennessee Volunteers (18-11)
When: 3:00 p.m. CT
Where: Thompson-Boling Arena (21,678)

TV: ESPN (Mark Jones, Jimmy Dykes)
Radio: Tiger Radio Network (Mike Kelly, Linker Link)

With a win in Knoxville, Missouri clinches the third seed in the SEC Tournament. With a loss, the Tigers are either fourth, fifth or (most likely) sixth. So, uh, how about a win then?

M-I-Z...

Tennessee 64, Missouri 62: Rerun

$
0
0
20130222_kkt_bh2_182

The whistles were inconsistent, Phil Pressey did something silly in the final minute, etc. It was a Mizzou road game, in other words. Mizzou lost and missed out on a double-bye in the SEC Tournament because this episode played out on five separate occasions in conference play. Good times.

Real analysis tomorrow. For now, here's your Saturday evening thread. Please try to have a decent evening and deposit any grandiose rants in the game thread.

Study Hall: Home Team y, Mizzou y-2

$
0
0
20130309_mjm_bs1_003

Your Trifecta: Bowers-Pressey-Ross. Your winner: Armchair Analyst.

Welcome to Study Hall's Greatest Hits! Hits like "This Isn't All on Phil Pressey,""Ross and Brown Sure Did Shoot Poorly," and "Don't Sit Certain Guys for So Damn Long Because of First-Half Fouls" can all be yours, along with an unreleased rarity like "Man, Did Mizzou Get Smoked on the Glass," for the low, low price of $9.99!

Tennessee 64, Mizzou 62

Mizzou
Opp.
Pace (No. of Possessions)61.1
Points Per Possession (PPP)1.011.05
Points Per Shot (PPS)1.071.07
2-PT FG%48.8%37.5%
3-PT FG%23.5%35.0%
FT%66.7%81.3%
True Shooting %48.0%47.7%
MizzouOpp.
Assists139
Steals74
Turnovers812
Ball Control Index (BCI)
(Assists + Steals) / TO
2.501.08
MizzouOpp.
Expected Offensive Rebounds1314
Offensive Rebounds1018
Difference-3+4

Man, Did Mizzou Get Smoked on the Glass

It started before Laurence Bowers got his second foul and continued for much of the game. Mizzou controlled the glass for the first few minutes of the game, and Tennessee won the battle most of the way thereafter. Mizzou made eight of its first 11 shots on offense, made just 16 of its final 47 (34%) and grabbed just 10 offensive rebounds (six of the deadball, no-putbacks variety), while Tennessee grabbed eight offensive rebounds in the first and another 10 in the second. Tennessee missed 38 shots from the field, and somehow Tony Criswell and Ryan Rosburg combined for one defensive rebound in 20 minutes.

The result: Mizzou held Tennessee to horrendous 37 percent shooting, dominated on ball control ... and lost.

Mizzou Player Stats

(Definitions at the bottom of the post.)

Player
AdjGSGmSc/MinLine
Laurence Bowers24.51.0224 Min, 20 Pts (8-12 FG, 2-4 3PT, 2-3 FT), 5 Reb, 4 Blk
Phil Pressey11.90.3336 Min, 10 Pts (4-12 FG, 1-6 3PT, 1-2 FT), 9 Ast, 3 Reb, 3 Stl, 3 TO
Earnest Ross10.60.3828 Min, 9 Pts (2-10 FG, 1-4 3PT, 4-4 FT), 6 Reb (3 Off), 2 Ast
Keion Bell7.30.2529 Min, 7 Pts (3-5 FG, 1-2 FT), 2 Ast, 2 Blk, 2 TO
Alex Oriakhi3.80.1722 Min, 6 Pts (3-6 FG, 0-2 FT), 6 Reb (2 Off), 4 PF
Jabari Brown2.60.0735 Min, 6 Pts (2-7 FG, 0-2 3PT, 2-2 FT), 3 Reb
Negus Webster-Chan-0.5-0.096 Min, 0 Pts (0-1 3PT)
Tony Criswell-0.6-0.0514 Min, 4 Pts (2-5 FG), 2 Reb, 2 TO
Ryan Rosburg-1.6-0.266 Min, 3 PF
PlayerUsage%Floor%Touches/
Poss.
%Pass%Shoot%Fouled%T/O
Bowers31%59%2.047%40%14%0%
Pressey24%39%6.276%17%2%4%
Ross23%31%2.947%40%14%0%
Bell15%44%2.357%24%8%10%
Oriakhi20%33%1.30%69%20%11%
Brown12%31%0.80%80%20%0%
NWC9%0%0.50%100%0%0%
Criswell28%24%1.60%71%0%29%

This Isn't All on Phil Pressey

You knew this was coming, and I don't even want to type it. Rage at Phil Pressey all you want for the ill-advised 3 at the end -- he deserves it. (And if you want to toss some rage toward Frank Haith for acting surprised that Pressey took that shot and not calling time out to call a play, go for it. We know how Haith wants to handle the final possessions of a game, and he's pretty consistent about it, but there's no questioning that it has cost this specific team a bit.)

But Flip was also one of about 3.5 Missouri players to actually show up for the game's first 39 minutes. Bowers was incredible, Pressey was decent, Ross was decent in the hustle stats (and not from the field), Bell was quiet for a good chunk of the game (and passive on defense at ill-advised times) ... and the rest of the team did next to nothing. Alex Oriakhi grabbed some rebounds but scored half of the 12 points per game he had been averaging of late, while Brown, NWC, Criswell and Rosburg combined for -0.1 Adj. GS points. I'm tired of having to say it, but the late Pressey miscue doesn't matter if other Mizzou players bring even their B-games.

Brown and Ross Sure Did Shoot Poorly

Remember back in December and January, when Jabari Brown and Earnest Ross would alternate between shooting 60% in one game and 10% in the next (slight exaggeration, but only slight)? They stabilized a bit as the season progressed, but ... there was no stabilizing yesterday. They combined to shoot 4-for-17 from the field (24%), 1-for-6 from 3-point range (17%). It's not like they were alone in regard to poor shooting. Bowers was 8-for-12, Oriakhi and Bell were 6-for-11, and everybody else was 10-for-35. But still. It was a flashback I didn't need.

Don't Sit Certain Guys for So Damn Long Because of First-Half Foul Trouble

About six minutes into the game, Laurence Bowers got called for two fouls in about a five-second span. The second one was legitimate ... the first one was crap. Regardless, Bowers went straight to the bench and swung his towel down, knowing he was now doomed to sit on the bench for the next 14 minutes of the game.

Heading into this game, by the way, Bowers was averaging 0.09 personal fouls per minute. On average, it would probably take him about 33 minutes to pick up another three fouls. And to be sure, he had played the first 6:20 of the game foul-free. He would play 18 second-half minutes foul-free.

I've asked it before, but ... why in the hell do coaches do this? Again, I can't hammer Frank Haith for it because he's not alone; in fact, if he had left Bowers in there, the announcers would have probably talked repeatedly about how odd it was for him to do that. And god forbid it backfire; Haith would have been destroyed for that. In coaching, you often make the wrong play because it's somehow also the less risky play. That's what "two fouls and you're done" is.

If you've got a foul-prone big, then it might make some sense to monitor his foul situation pretty closely. But if you've got Laurence Bowers, who is in no way a foul-prone big, then you can be a little more liberal. In the 11 minutes after Bowers went to the bench, Missouri was outscored, 19-8. In attempting to ensure that Bowers would get plenty of possessions in the second half, Haith sacrificed about 20-21 possessions in the first half. With Bowers playing at an absurdly high level on offense to that point, those 20-21 possessions cost Missouri the game.

Three Keys Revisited

From Friday's preview.

The Glass

I'm not sure rebounding has been more important to a single game this year. If Tennessee is grabbing rebounds, especially on the offensive end, then that pretty much confirms that they are also drawing fouls, getting points at the line, and softening up Mizzou's lineup on the interior. If Alex Oriakhi can both hit the defensive glass like he has of late (he has a 25% defensive rebounding rate in the last six games, which would be a Top 30 average for the entire season), and if Tony Criswell (21% in the last six games), Earnest Ross (16%), and Keion Bell (14%) can continue to pitch in (strangely, Laurence Bowers has only been at 10% in the last six), then the path to victory is pretty obvious. But if Tennessee is grabbing second chances, drawing fouls from Oriakhi and others, and ensuring that Frank Haith has to play players like Criswell and Ryan Rosburg more, then Mizzou's optimal lineup is not on the court, and the advantage shifts to Tennessee.

Expected Rebounds: Mizzou -7.

You think that made a difference? Again, this is what Tennessee does. They can't shoot, their defense comes and goes, and they aren't great at the ball handling. But they crash. And only Bowers (21% defensive rebound rate) and Oriakhi (18%) were prepared to handle it (which is awkward when they both end up sitting with two fouls in the first half).

Flipadelphia

It's a road game, which means all eyes are on Phil Pressey, and for all the reasons to which we've grown accustomed. If he's under control, finding open shooters, making that little tear-dropper in the lane, and playing reasonably acceptable defense (i.e. the opponent's point guard isn't going off, as has happened many times this year), then Mizzou is the better team.

Phil Pressey: 36 minutes, 10 points (4-12 FG, 1-2 FT), 9 assists, 3 steals, 3 rebounds, 3 turnovers, and one awful final-minute decision. Mostly solid ... and partially awful.

Slap the Floor

We saw against Arkansas and Florida just how well this team can play defense when the motivation is dialed up. (Yes, Arkansas got a lot of the same shots as South Carolina and LSU and just missed them; still, the defensive intensity was dramatically higher, and for a more sustained period of time.) Tennessee is not a good shooting team; don't let them find open shots. Don't let them find their rhythm. Force them to rebound against a great defensive rebounding Mizzou lineup. Hold them to fewer than 1.0 points per possession, or, hell, even 1.05, and you probably win.

Tennessee: 37.5% 2PT, 35.0% 3PT, 1.05 PPP

Mizzou's biggest issues on defense are that the Tigers don't turn you over and sometimes allow you some decent looks from the floor. (The FG% is not nearly as big an issue as we make it sometimes -- Mizzou's 86th in Effective FG%, which is actually pretty good -- but there are times...) Mizzou forced 12 turnovers and held Tennessee to some awful shooting, but they just couldn't secure the caroms, and it allowed Tennessee to creep over that magic 1.00 points per possession

Summary

In the end, a six-seed in the SEC Tournament is not the end of the world. It keeps Missouri out of Florida's side of the bracket, and Mizzou's path to the SEC finals could be Texas A&M-Ole Miss-Kentucky, three teams Missouri is more than capable of handling, even if they have to do it in a three-day span. But the what-if game is devastating. If Mizzou were basically one possession better on the road in SEC play, they legitimately could have gone 16-2 in the SEC and won the damn league. But they're the sixth seed instead.

This team's ceiling is high, and we know it. The Tigers were 24th in Pomeroy's rankings when Laurence Bowers got hurt, fell to 47th as he was fighting his way back, then surged back to 18th. If Bowers doesn't get hurt, Mizzou probably finishes around 10th or so. And the Tigers have not a single road game left on the schedule. The close-road-game issues doomed Mizzou to iffy seeds in both the SEC and NCAA Tournaments, but if you play well from here on out, it won't matter. The regular season determines how hard your road will be in March. Your play in March determines how we remember the season. Mizzou faltered at frustrating times with the former; now we find out about the latter, and in the end, the latter is all that matters.

---

AdjGS: a take-off of the Game Score metric (definition here) accepted by a lot of basketball stat nerds. It takes points, assists, rebounds (offensive & defensive), steals, blocks, turnovers and fouls into account to determine an individual's "score" for a given game. The "adjustment" in Adjusted Game Score is simply matching the total game scores to the total points scored in the game, thereby redistributing the game's points scored to those who had the biggest impact on the game itself, instead of just how many balls a player put through a basket.

Usage%: This "estimates the % of team possessions a player consumes while on the floor" (via). The usage of those possessions is determined via a formula using field goal and free throw attempts, offensive rebounds, assists and turnovers. The higher the number, the more prevalent a player is (good or bad) in a team's offensive outcome.

Floor%: Via Basketball-Reference.com: Floor % answers the question, "when Player X uses a possession, what is the probability that his team scores at least 1 point?". The higher the Floor%, the more frequently the team probably scores when the given player is involved.

Touches/Possession: Using field goal attempts, free throw attempts, assists and turnovers, Touches attempt to estimate "the number of times a player touched the ball in an attacking position on the floor." Take the estimated touches and divide it by the estimated number of possessions for which a player was on the court, and you get a rough idea of how many times a player touched the ball in a given possession. For point guards, you'll see the number in the 3-4 range. For shooting guards and wings, 2-3. For an offensively limited center, 1.30. You get the idea.

Anyway, using the Touches figure, we can estimate the percentage of time a player "in an attacking position" passes, shoots, turns the ball over, or gets fouled.

Mizzou Links, 3-11-13

$
0
0
Sec_tourney

Mizzou Basketball Links

  • Tennessee > Mizzou
    The Trib: Tigers watch another one slip away on the road
    The Missourian: Missouri loses another tough game on the road
    KC Star: MU notebook: Son of former Tiger gets in the game for Vols
    Post-Dispatch: In familiar form, Mizzou falls to Vols
  • SEC Tournament
    MUtigers.com: Mizzou Earns No. 6 Seed at SEC Tournament
    The Missourian: Missouri looks ahead to SEC Tournament

Mizzou Football Links

  • Spring Ball
    PowerMizzou: Spring Preview: Offensive Line
    PowerMizzou: Spring Preview: Defensive Line
  • 2014 Recruiting
    PowerMizzou: Lee's Summit LB Jimmie Swain: In like a lion
    PowerMizzou: Surprise for [Lee's Summit West receiver Monte] Harrison
    PowerMizzou: Missouri Offers Another Georgia Prospect
    PowerMizzou: First visit a success for [Hazelwood Central OL Roderick] Johnson
  • The Draft
    The Missourian: Confident Sheldon Richardson awaits NFL after MU
    PowerMizzou: PMTV-HD: Sheldon Richardson Pro Day
    PowerMizzou: PMTV-HD: T.J. Moe Pro Day
    PowerMizzou: PMTV-HD: Zaviar Gooden Pro Day
  • Already In The NFL
    Shutdown Corner: Falcons sign safety William Moore to five-year extension
    Shutdown Corner: Chargers WR Danario Alexander receives low RFA tender, might be a major bargain
    We Are Mizzou: Jeremy Maclin Charity Camp
  • Nice
    The Trib: Former Tiger A.J. Ricker to coach Illini's line

SEC

  • The Transition Year
    KC Star: A costly year of change for KU, MU athletics

Mizzou Wrestling Links

  • Two Years, Two Conference Titles
    MUtigers.com: Tiger Roar Through MACs, Crowned Conference Champions
    The Trib: Missouri wrestlers claim MAC championship
  • Olympics
    The Missourian: Fate of Olympic wrestling an unpleasant distraction for Missouri's Dom Bradley

Mizzou Softball Links

So basically, for both Softball and Baseball, Friday was awesome, Saturday stunk, and Sunday rained. Mother Nature is vengeful.

Mizzou Baseball Links

Other Mizzou Links

  • Mizzou Gymnastics
    MUtigers.com: Howard Hits Career-High on Senior Night
    The Trib: Missouri gymnasts finish strong after early setback
    The Missourian: Senior gymnast Brittany Bendoff coaches after career-ending injury
  • Mizzou Tennis
    MUtigers.com: Tennis Suffers 5-2 Loss to Kentucky
    MUtigers.com: Mizzou Falls to No. 11 Vanderbilt, 6-1
  • Mizzou Track & Field
    MUtigers.com: Woodson Earns All-American in 60m Dash
    The Trib: MU's Woodson fifth at NCAAs
  • Mizzou Women's Basketball
    Mizzou Network (YouTube): Inside Access: WBB Visits Elementary School

Advanced Baseline men's tennis rankings (March 11, 2013)

$
0
0
160159249

Some sports rely on rankings, and others use them for conversation. College basketball, for instance, really doesn't need polls of any sort, but college football relies on them (at least, until the impending playoff goes into effect). For some sports, point totals are everything -- NASCAR and soccer, for instance. But in no sport are rankings more relevant than in tennis. Rankings often determine not only seeding, but qualification. One break here, one ratings boost there, and you can move from qualifying tournaments to the bigger draws.

It is a bit problematic, then, that the systems used by the ATP men's tour and the WTA women's tour are a bit arbitrary and, in some cases, in no way indicative of actual skill. The luck of your tournament draw, especially in larger tournaments, determines almost as much of your ranking as your ability does.

Here's the general structure of the ATP point system, for instance.

Type of TournamentWFSFQFR16R32R64R128Q
Grand Slams2000120072036018090451025
Barclays ATP World Tour Finals1500*
ATP World Tour Masters 10001000600360180904510(25)(10)25***
ATP 5005003001809045(20)20***
ATP 250250150904520(5)12***
Challenger 125,000125754525105
Challenger 125,00011065402095
Challenger 100,00010060351885
Challenger 75,0009055331785
Challenger 50,0008048291573
Challenger 35,0008048291563
Futures** 15,00035201041
Futures** 15,0002715831
Futures** 10,0001810621
*Barclays ATP World Tour finals 1500 for undefeated Champion (200 for each round robin match win, plus 400 for a semi-final win, plus 500 for the final win).
** ATP Doubles Rankings points will be awarded in Futures tournaments beginning with the semi-final round.
*** For ATP 1000: 12 points only if the main draw is larger than 56. For ATP 500: 10 points only if the main draw is larger than 32. For ATP 250: 5 points only if the main draw is larger than 32.

Now, generally speaking, the best players are going to rank the highest in a system based on points. You don't need advanced analytics, in other words, to determine that Novak Djokovic is the best, most consistent tennis player in the men's game. But away from the top tier, your ranking is determined as much by which tournaments you qualified for or entered, and how many easy first-round matches you perhaps drew or byes you received. In this way, tennis rankings can be incredibly unfair.

So we've created a better way. Over the last few months, I've been working with Colin Davy to create a measure we're calling Advanced Baseline. Think of it as a Ken Pomeroy rankings system for tennis, one that is at once both evaluative and predictive, one that rewards actual performance.

(To be clear, by the way: Colin did the work here. I just helped with quality control checks, outliers, and, now, promotion.)

Here's Colin on some of the nitty gritty details.

What makes this rankings system fundamentally different from the ATP/WTA formula is that they’re volume-independent: unlike ATP/WTA rankings, they’re not a simple tally of wins with pre-determined point values according to tournament and round progression.

The basic procedure for determining the base ranking for each player is as follows:

  • For each match in the evaluation period, the model estimates the probability of the winner being a better player than the loser based on the score of the match (so a 6-2, 6-1 victory will count more in the winner’s favor than a 7-6, 3-6, 7-5 victory).
  • The score-to-probability conversion is based on a best-fit curve that’s constructed outside of the rankings algorithm itself. From there, the head-to-head probabilities are collided against each other to reconcile the messy and often-times contradictory results from actual match play (i.e. how good is Sloane Stephens really, given that she beat Serena Williams at the Australian Open but lost to Ursula Radwanska 2 months later at Indian Wells?), with greater weight placed on more recent results. The output of this process is a steady-state rank order of players that ends up being powerfully predictive.
  • The surface adjustments to each player’s base ranking are calculated using a completely separate module that takes the base rankings as its input. The base rankings are used to predict head-to-head win probabilities for each future matchup. Over time, the module compares how often each player is expected to win (from the predicted win probabilities) to how often they actually win for each surface. The difference between expected win rate and actual win rate is the feedback signal that drives the surface adjustments: when Rafael Nadal starts winning on clay courts more often than the model says he will (or when Andy Roddick loses more often than he should), their rankings will be adjusted accordingly for that surface.

So what’s the benefit of using something this complicated to rank players over the existing ATP/WTA system? For one, it does a much better job of rewarding players that beat top-tier competition: if you beat a top 25 player, you get the same amount of credit no matter what round of the tournament in which it happened.

Second, it does a good job of filtering out players that get an oversized boost to their rankings from simply playing a high volume of tournaments and/or players that win tournaments with weak field strengths (i.e. Juan Monaco winning Hamburg 2012 when most top-tier players were resting for the Olympics).

And third, taking scoring margin into account provides a lot more insight: not only does it help filter out “lucky” wins, but it also helps differentiate between the lower-level players who can’t get accepted into anything besides Futures/Challenger Tour tournaments.

Quite simply, Advanced Baseline ranks players by their performance in matches, not tournaments.

Below are the Advanced Baseline men's rankings for March 11.

Some notes:

  • Among the ATP's Top 100 (also included below), those most underrated by the ATP (and highly rated by Advanced Baseline) are, in general, older players who don't play as many tournaments due to either choice or injury: David Nalbandian (ATP No. 93, AB No. 17), Lleyton Hewitt (ATP No. 98, AB No. 33), James Blake (ATP No. 99, AB No. 60), Tommy Robredo (ATP No. 69, AB No. 47), Mardy Fish (ATP No. 32, AB No. 18). But there are some other players who have perhaps experienced some bad luck in the rankings: Jesse Levine, Carlos Berlocq, Santiago Giraldo, Yen-Hsun Lu, Paul-Henri Mathieu, Michael Llodra, Jarkko Nieminen and Ernests Gulbis are all in the AB Top 50 but outside of the Top 50 in the official rankings.
  • On the flipside, quite a few players have reached the ATP Top 100 by either playing in a lot of tournaments or getting good draws, but not necessarily playing at a Top 100 level: Pablo Andujar, Tatsuma Ito, Martin Alund, Joao Sousa, Go Soeda, Paolo Lorenzi, et cetera.
  • I don't think David Ferrer is going to be above Rafael Nadal for too long.
  • At 34, Tommy Haas might still be one of the 10 best men's tennis players in the world. That's staggering. But he needs to bring it in a slam for once -- he's lost in the first round of three straight. (Best-of-5 might be his undoing at this point.)
  • Your Top 20 Americans (not including Andy Roddick, who hasn't quite cycled out yet):
    1. Mardy Fish (AB No. 18)
    2. Sam Querrey (No. 20)
    3. John Isner (No. 29)
    4. Brian Baker (No. 51)
    5. James Blake (No. 60)
    6. Ryan Harrison (No. 80)
    7. Michael Russell (No. 83)
    8. Steve Johnson (No. 98)
    9. Jack Sock (No. 114)
    10. Tim Smyczek (No. 119)
    11. Ryan Sweeting (No. 122)
    12. Bradley Klahn (No. 127)
    13. Rhyne Williams (No. 130)
    14. Wayne Odesnik (No. 131)
    15. Donald Young (No. 141)
    16. Rajeev Ram (No. 154)
    17. Bobby Reynolds (No. 157)
    18. Denis Kudla (No. 169)
    19. Alex Kuznetsov (No. 190)
    20. Daniel Kosakowski (No. 240)
  • I honestly thought Ryan Harrison might benefit from the AB rankings. His slam draws have been so incredibly unlucky through the years (it seems he's always playing a Top 10 player by the second round at the latest) that it seems like luck has prevented him from racking up a higher ATP point total. Alas, these rankings show he still has a long way to go.
Surface Factors
RankPlayerNationBase RankClayHardGrassATP RankDiffTournaments
1Novak Djokovic(SRB)1.2530.1330.204-0.0041019
2Roger Federer(SUI)1.1810.1030.1240.0592020
3Andy Murray(GBR)1.1480.0090.1490.0803019
4David Ferrer(ESP)1.1420.2080.073-0.0214026
5Rafael Nadal(ESP)1.1240.2840.100-0.0205020
6Juan Martin Del Potro(ARG)1.1050.1390.1030.0217122
7Tomas Berdych(CZE)1.0770.0890.092-0.0136-124
8Richard Gasquet(FRA)1.0470.0860.017-0.00110223
9Jo-Wilfried Tsonga(FRA)1.0430.0130.0630.0488-126
10Tommy Haas(GER)0.9970.0170.0650.03219923
11Janko Tipsarevic(SRB)0.9950.0680.0810.0209-229
12Stanislas Wawrinka(SUI)0.9870.1160.090-0.03018622
13Marin Cilic(CRO)0.9810.0780.0400.00712-125
14Kei Nishikori(JPN)0.9810.0660.1300.03816223
15Nicolas Almagro(ESP)0.9800.1970.010-0.00211-425
16Milos Raonic(CAN)0.9690.0090.101-0.00617124
17David Nalbandian(ARG)0.9650.0310.011-0.008937618
18Mardy Fish(USA)0.939-0.0460.1420.033321417
19Mikhail Youzhny(RUS)0.9380.0140.0020.006301125
20Sam Querrey(USA)0.9360.0050.0760.00223327
21Juan Monaco(ARG)0.9360.133-0.038-0.01714-723
22Kevin Anderson(RSA)0.9290.0180.105-0.016371525
23Radek Stepanek(CZE)0.9260.0390.067-0.001411821
24Gilles Simon(FRA)0.9250.0740.0880.00113-1126
25Marcos Baghdatis(CYP)0.918-0.0260.0750.030351024
26Nikolay Davydenko(RUS)0.9150.0650.083-0.038421625
27Julien Benneteau(FRA)0.914-0.0030.079-0.00228126
28Philipp Kohlschreiber(GER)0.9130.0620.0560.04121-725
29John Isner(USA)0.912-0.0020.1790.02815-1427
30Fernando Verdasco(ESP)0.9080.0870.035-0.01529-123
31Andreas Seppi(ITA)0.9020.1100.0160.00520-1129
32Alexandr Dolgopolov(UKR)0.9010.1610.052-0.01522-1025
33Lleyton Hewitt(AUS)0.901-0.0210.0320.063986515
34Andy Roddick(USA)0.893-0.0710.1040.046N/AN/AN/A
35Bernard Tomic(AUS)0.891-0.0170.1470.023451028
36Gael Monfils(FRA)0.8870.0710.073-0.0081067024
37Grigor Dimitrov(BUL)0.8850.0790.0520.01331-623
38Feliciano Lopez(ESP)0.8800.0630.0710.04634-428
39Jarkko Nieminen(FIN)0.8780.0340.013-0.024571828
40Michael Llodra(FRA)0.870-0.003-0.0170.017632319
41Denis Istomin(UZB)0.869-0.0030.1170.04043232
42Paul-Henri Mathieu(FRA)0.8620.0790.006-0.010662424
43Thomaz Bellucci(BRA)0.8610.163-0.022-0.01038-526
44Florian Mayer(GER)0.8580.0910.0460.04527-1729
45Marcel Granollers(ESP)0.8550.0890.029-0.00833-1227
46Xavier Malisse(BEL)0.855-0.0260.0210.05350426
47Tommy Robredo(ESP)0.8430.157-0.008-0.053692221
48Jeremy Chardy(FRA)0.8410.1040.068-0.00325-2323
49Ivo Karlovic(CRO)0.840-0.0240.0200.0641439422
50Ernests Gulbis(LAT)0.8400.0450.1030.001671722
Surface Factors
RankPlayerNationBase RankClayHardGrassATP RankDiffTournaments
51Brian Baker(USA)0.8370.0620.0150.00456522
52Yen-Hsun Lu(TPE)0.835-0.0260.089-0.007792728
53Santiago Giraldo(COL)0.8330.0980.030-0.021822924
54Carlos Berlocq(ARG)0.8320.108-0.010-0.033853131
55Jerzy Janowicz(POL)0.8310.0780.0110.02824-3122
56Jurgen Melzer(AUT)0.8310.0300.018-0.00448-826
57Ivan Dodig(CRO)0.8290.0050.054-0.00260327
58Viktor Troicki(SRB)0.8270.0510.035-0.01444-1429
59Igor Sijsling(NED)0.8250.0180.040-0.006721324
60James Blake(USA)0.825-0.0260.076-0.043993921
61Jesse Levine(CAN)0.8250.0230.0080.026973626
62Edouard Roger-Vasselin(FRA)0.8200.0030.046-0.003781630
63Gilles Muller(LUX)0.8200.0140.074-0.01165227
64Martin Klizan(SVK)0.8180.167-0.020-0.00426-3827
65Roberto Bautista-Agut(ESP)0.8160.0390.083-0.01151-1426
66Benoit Paire(FRA)0.8140.0910.0370.03240-2630
67Lukas Lacko(SVK)0.813-0.0380.0830.003811426
68Steve Darcis(BEL)0.8100.097-0.0130.0201053725
69Lukasz Kubot(POL)0.8070.0570.006-0.009942524
70Marinko Matosevic(AUS)0.807-0.0060.0900.01353-1729
71David Goffin(BEL)0.8040.0580.021-0.00754-1725
72Fabio Fognini(ITA)0.8030.2030.0030.00436-3631
73Benjamin Becker(GER)0.803-0.0430.0200.088911829
74Aljaz Bedene(SLO)0.8020.118-0.003-0.01677325
75Victor Hanescu(ROU)0.8010.135-0.029-0.03055-2028
76Simone Bolelli(ITA)0.8010.141-0.0240.00975-130
77Ricardas Berankis(LTU)0.801-0.0040.0770.00080318
78Nicolas Mahut(FRA)0.7990.010-0.0300.0391456717
79Albert Montanes(ESP)0.7990.125-0.063-0.017951625
80Ryan Harrison(USA)0.798-0.0010.0930.00073-724
81Sergiy Stakhovsky(UKR)0.798-0.0320.051-0.0011082729
82Lukas Rosol(CZE)0.7980.0900.0250.02762-2030
83Michael Russell(USA)0.796-0.0400.064-0.00870-1329
84Albert Ramos(ESP)0.7950.1770.001-0.00758-2630
85Robin Haase(NED)0.7930.0980.030-0.01247-3831
86Olivier Rochus(BEL)0.792-0.0400.0270.0101506429
87Dudi Sela(ISR)0.786-0.0430.0720.0251223528
88Dmitry Tursunov(RUS)0.786-0.0340.1010.02776-1223
89Horacio Zeballos(ARG)0.7860.1760.022-0.01339-5028
90Michael Berrer(GER)0.785-0.0310.001-0.0261304022
91Alejandro Falla(COL)0.7850.0730.0290.03259-3230
92Philipp Petzschner(GER)0.784-0.0210.0100.0351192719
93Frank Dancevic(CAN)0.783-0.0480.0530.0031414817
94Ruben Bemelmans(BEL)0.783-0.004-0.0040.0081172325
95Guillaume Rufin(FRA)0.7820.1060.0010.01289-624
96Andrey Kuznetsov(RUS)0.7820.1070.011-0.00268-2824
97Alex Bogomolov Jr.(RUS)0.781-0.0230.064-0.0051404331
98Steve Johnson(USA)0.780-0.0070.035-0.0161343615
99Matthias Bachinger(GER)0.7780.015-0.001-0.0231091030
100Filippo Volandri(ITA)0.7770.113-0.067-0.0121121231
Surface Factors
RankPlayerNationBase RankClayHardGrassATP RankDiffTournaments
101Tobias Kamke(GER)0.7770.0350.003-0.00287-1429
102Blaz Kavcic(SLO)0.7760.0910.043-0.00788-1429
103Daniel Brands(GER)0.7750.0670.039-0.02074-2924
104Grega Zemlja(SLO)0.7750.0470.0510.00861-4323
105Guillermo Garcia-Lopez(ESP)0.7740.0580.0140.01286-1930
106Daniel Gimeno-Traver(ESP)0.7720.135-0.009-0.03452-5432
107Paolo Lorenzi(ITA)0.7700.1560.023-0.01549-5835
108Bjorn Phau(GER)0.7700.0430.037-0.0101211327
109Evgeny Donskoy(RUS)0.7680.0470.035-0.01483-2627
110Thiemo de Bakker(NED)0.7670.0970.0130.009111123
111Marc Gicquel(FRA)0.7660.047-0.027-0.004120924
112Jan Hajek(CZE)0.7650.145-0.023-0.01596-1624
113Igor Andreev(RUS)0.7650.0750.021-0.0131554215
114Jack Sock(USA)0.7640.0360.035-0.0011251115
115Jurgen Zopp(EST)0.7630.0760.013-0.009124919
116Adrian Mannarino(FRA)0.762-0.0290.0660.0011543823
117Leonardo Mayer(ARG)0.7610.1430.030-0.00964-5322
118Federico Delbonis(ARG)0.7590.159-0.007-0.010116-223
119Tim Smyczek(USA)0.758-0.0080.0950.034104-1520
120Cedrik-Marcel Stebe(GER)0.7570.0840.0330.0071674717
121Julian Reister(GER)0.7560.144-0.023-0.0051967511
122Ryan Sweeting(USA)0.7560.0190.027-0.0161735119
123Mischa Zverev(GER)0.755-0.0110.034-0.0061442123
124Marius Copil(ROU)0.7530.0100.003-0.0041361223
125Kenny de Schepper(FRA)0.753-0.004-0.0070.040102-2328
126Robby Ginepri(USA)0.752-0.0500.010-0.02629416811
127Bradley Klahn(USA)0.752-0.0200.039-0.0042239615
128Illya Marchenko(UKR)0.746-0.0230.0400.0081421420
129Go Soeda(JPN)0.745-0.0100.139-0.01271-5829
130Rhyne Williams(USA)0.7440.0670.0160.000133322
131Wayne Odesnik(USA)0.7420.0750.020-0.014131020
132Pablo Carreno-Busta(ESP)0.7410.1230.0800.00037123911
133Matthew Ebden(AUS)0.737-0.0210.0550.018113-2025
134Maxime Authom(BEL)0.7370.027-0.0150.0111592527
135Andreas Haider-Maurer(AUT)0.7360.093-0.016-0.001115-2022
136Mikhail Kukushkin(KAZ)0.7350.0750.030-0.0171582218
137Jan-Lennard Struff(GER)0.7340.0410.014-0.011118-1929
138Jan Hernych(CZE)0.7340.0280.0140.0001925416
139Josselin Ouanna(FRA)0.7330.0250.031-0.026139027
140Peter Gojowczyk(GER)0.733-0.0070.0240.0051814122
141Donald Young(USA)0.732-0.0240.066-0.0221904926
142Stephane Robert(FRA)0.7310.0170.031-0.0121803827
143Paul Capdeville(CHI)0.7290.0630.047-0.026147424
144Florent Serra(FRA)0.7290.0580.0270.016137-726
145Uladzimir Ignatik(BLR)0.728-0.0290.056-0.001153823
146Yuichi Sugita(JPN)0.728-0.0200.0400.012138-823
147Ilija Bozoljac(SRB)0.7280.0300.076-0.00836321611
148Ruben Ramirez Hidalgo(ESP)0.7280.060-0.029-0.014100-4831
149Marco Chiudinelli(SUI)0.728-0.0300.050-0.0171651621
150Rogerio Dutra Da Silva(BRA)0.7270.0280.015-0.017114-3629
Surface Factors
RankPlayerNationBase RankClayHardGrassATP RankDiffTournaments
151Daniel Munoz-De La Nava(ESP)0.7240.0780.059-0.017135-1623
152Teymuraz Gabashvili(RUS)0.7240.0400.005-0.0151934124
153Bastian Knittel(GER)0.7230.034-0.0310.0041984522
154Rajeev Ram(USA)0.723-0.0260.0300.053101-5328
155Malek Jaziri(TUN)0.7220.0690.0450.002129-2622
156Evgeny Korolev(KAZ)0.7220.0910.021-0.0102034718
157Bobby Reynolds(USA)0.720-0.0020.111-0.018166921
158Stephane Bohli(SUI)0.720-0.0640.035-0.01843327513
159Joao Sousa(POR)0.7190.0970.020-0.00692-6730
160Karol Beck(SVK)0.718-0.051-0.0030.019169918
161Flavio Cipolla(ITA)0.7160.0420.054-0.021107-5428
162Adrian Ungur(ROU)0.7160.101-0.029-0.015110-5228
163Dominik Meffert(GER)0.7160.040-0.023-0.0151912821
164Pablo Andujar(ESP)0.7150.151-0.026-0.02646-11831
165Andrey Golubev(KAZ)0.7130.0400.016-0.0201872219
166Martin Alund(ARG)0.7120.137-0.030-0.01690-7629
167Antonio Veic(CRO)0.7110.0840.001-0.021127-4025
168Simon Greul(GER)0.7100.099-0.0110.003156-1221
169Denis Kudla(USA)0.7100.0020.035-0.007160-924
170Boris Pashanski(SRB)0.7090.058-0.050-0.027168-227
171Inigo Cervantes(ESP)0.7080.0830.0110.017164-721
172Martin Fischer(AUT)0.7070.0050.0100.01632415220
173Potito Starace(ITA)0.7070.065-0.072-0.0222053217
174Dustin Brown(GER)0.7070.0190.0070.005163-1120
175Victor Crivoi(ROU)0.7070.114-0.030-0.0212376224
176Robert Farah(COL)0.7050.009-0.009-0.0032113515
177Tatsuma Ito(JPN)0.7050.0100.0470.00184-9328
178Arnau Brugues-Davi(ESP)0.705-0.0160.085-0.007177-124
179John Millman(AUS)0.703-0.0130.0510.003161-1826
180Gastao Elias(POR)0.7030.0830.051-0.014132-4826
181Jimmy Wang(TPE)0.702-0.0260.0330.019178-322
182Andreas Beck(GER)0.7020.1060.0050.0125683868
183Igor Kunitsyn(RUS)0.701-0.0250.046-0.028162-2132
184Sergio Gutierrez-Ferrol(ESP)0.6990.098-0.023-0.011182-222
185Joao Souza(BRA)0.6990.1070.000-0.013126-5922
186Rui Machado(POR)0.6990.085-0.008-0.01831212613
187Jiri Vesely(CZE)0.6980.0470.021-0.0132364925
188Vasek Pospisil(CAN)0.698-0.0210.053-0.004128-6026
189Sergei Bubka(UKR)0.696-0.0400.0390.0172001118
190Alex Kuznetsov(USA)0.6940.0040.0190.0062556520
191Dusan Lajovic(SRB)0.6930.0840.001-0.018152-3925
192Guido Pella(ARG)0.6930.0940.0030.000103-8924
193Matteo Viola(ITA)0.6930.1330.0180.023123-7030
194Jesse Huta Galung(NED)0.6910.0410.0070.0092263221
195Javier Marti(ESP)0.6900.0680.015-0.009195027
196Rik de Voest(RSA)0.690-0.0570.032-0.00431311722
197Andrej Martin(SVK)0.6880.0810.024-0.011175-2230
198Miloslav Mecir(SVK)0.6880.0180.023-0.00936616812
199Diego Sebastian Schwartzman(ARG)0.6880.1490.0120.000151-4828
200Peter Polansky(CAN)0.6850.0110.030-0.005186-1428
Surface Factors
RankPlayerNationBase RankClayHardGrassATP RankDiffTournaments
201Pedro Sousa(POR)0.6840.068-0.005-0.0082313024
202Adrian Menendez-Maceiras(ESP)0.6840.0150.0740.003207524
203Tim Puetz(GER)0.6840.038-0.0280.00035515214
204Danai Udomchoke(THA)0.683-0.0260.068-0.007204018
205Farrukh Dustov(UZB)0.6820.051-0.0260.0172151016
206Eduardo Schwank(ARG)0.6820.087-0.020-0.020228227
207Damir Dzumhur(BIH)0.6800.006-0.0030.0012221529
208Thiago Alves(BRA)0.6800.0320.053-0.002149-5923
209Frederico Gil(POR)0.6800.0110.021-0.021183-2622
210Eric Prodon(FRA)0.6800.062-0.032-0.01034413410
211Ivan Sergeyev(UKR)0.6790.0870.042-0.012148-6330
212James Ward(GBR)0.6780.0120.0320.013209-317
213Maxime Teixeira(FRA)0.6780.0430.0020.0152705725
214John-Patrick Smith(AUS)0.677-0.012-0.003-0.0022342022
215Yannick Mertens(BEL)0.6760.0210.022-0.0122331827
216Jonathan Dasnieres de Veigy(FRA)0.6760.085-0.0180.014146-7021
217Amir Weintraub(ISR)0.675-0.0120.114-0.009179-3824
218Matwe Middelkoop(NED)0.6750.077-0.007-0.0112422419
219Andis Juska(LAT)0.6740.016-0.084-0.0143068717
220Jan Mertl(CZE)0.674-0.0660.016-0.021172-4827
221Marsel Ilhan(TUR)0.6720.0290.061-0.003206-1526
222Michal Przysiezny(POL)0.672-0.012-0.018-0.004176-4620
223Dusan Lojda(CZE)0.6720.092-0.016-0.0142432032
224Ricardo Mello(BRA)0.6710.0210.028-0.02740918512
225Lamine Ouahab(ALG)0.6700.074-0.011-0.0162805515
226Pavol Cervenak(SVK)0.6700.058-0.039-0.014229323
227Chris Guccione(AUS)0.6690.0030.045-0.01458435710
228Gianluca Naso(ITA)0.6690.095-0.026-0.012194-3423
229Ivo Minar(CZE)0.6690.0470.000-0.0172411219
230Facundo Bagnis(ARG)0.6690.107-0.010-0.0122744421
231Blaz Rola(SLO)0.6670.075-0.0130.0003037215
232Walter Trusendi(ITA)0.6670.042-0.0300.00036913718
233Dominic Thiem(AUT)0.6660.080-0.0090.0063057217
234Izak van der Merwe(RSA)0.666-0.0300.0050.0682491522
235Alex Bogdanovic(GBR)0.666-0.003-0.0360.0043147917
236Ze Zhang(CHN)0.666-0.0160.0160.010157-7920
237Oleksandr Nedovyesov(UKR)0.6660.0640.0100.000199-3828
238Ivan Navarro(ESP)0.6650.0180.0130.0162592123
239Guido Andreozzi(ARG)0.6650.0710.0210.000170-6923
240Daniel Kosakowski(USA)0.6640.0070.0300.000247721
241Facundo Arguello(ARG)0.6630.1090.0020.013201-4023
242Simone Vagnozzi(ITA)0.6620.023-0.022-0.008239-324
243Alberto Brizzi(ITA)0.6610.051-0.0190.0003217817
244Pierre-Hugues Herbert(FRA)0.6610.0030.0130.007232-1227
245Jamie Baker(GBR)0.660-0.0050.0380.000210-3528
246Thomas Fabbiano(ITA)0.6590.0620.026-0.007244-223
247Di Wu(CHN)0.659-0.0050.060-0.008174-7320
248Gregoire Burquier(FRA)0.6580.000-0.004-0.006225-2321
249Samuel Groth(AUS)0.6570.0050.0600.062189-6023
250Konstantin Kravchuk(RUS)0.657-0.0460.031-0.004257722
Surface Factors
RankPlayerNationBase RankClayHardGrassATP RankDiffTournaments
251Andre Ghem(BRA)0.6570.0180.005-0.0113328120
252Denys Molchanov(UKR)0.656-0.0180.051-0.013214-3822
253David Guez(FRA)0.656-0.0110.026-0.005227-2622
254Michael Yani(USA)0.6560.0000.022-0.004218-3618
255Nils Langer(GER)0.6550.049-0.022-0.0013176217
256Austin Krajicek(USA)0.654-0.0190.0390.00046220615
257James Duckworth(AUS)0.6540.0390.029-0.002224-3324
258Greg Jones(AUS)0.654-0.0070.058-0.0233226415
259Tennys Sandgren(USA)0.653-0.0070.0480.014216-4327
260Roberto Carballes Baena(ESP)0.6520.054-0.009-0.0202933327
261Maximo Gonzalez(ARG)0.6500.088-0.022-0.01638212111
262Augustin Gensse(FRA)0.6500.055-0.001-0.012310489
263Yuki Bhambri(IND)0.6480.0190.032-0.014266313
264Diego Junqueira(ARG)0.6470.030-0.017-0.00639012619
265Steven Moneke(GER)0.6470.049-0.0150.0003114621
266Nikola Mektic(CRO)0.6470.032-0.009-0.002267124
267Agustin Velotti(ARG)0.6460.0540.027-0.015185-8223
268Marc Sieber(GER)0.6460.036-0.0010.00050824018
269Nicolas Renavand(FRA)0.6460.029-0.010-0.017268-119
270Attila Balazs(HUN)0.6460.066-0.0180.000256-1416
271Nick van der Meer(NED)0.6460.0420.0070.00048221112
272Romain Jouan(FRA)0.6450.017-0.0090.0013618919
273Marco Trungelliti(ARG)0.6430.101-0.0150.003197-7622
274Marcin Gawron(POL)0.6430.0240.0180.0003497519
275Mirza Basic(BIH)0.6420.0010.0020.000272-321
276Albano Olivetti(FRA)0.642-0.0200.0040.0083012516
277Thomas Schoorel(NED)0.6420.0930.001-0.0152881119
278Jaroslav Pospisil(CZE)0.6410.075-0.005-0.00642414616
279Daniel Evans(GBR)0.641-0.0070.035-0.0243678816
280Niels Desein(BEL)0.6400.0180.044-0.004217-6328
281Fabrice Martin(FRA)0.640-0.0320.052-0.024285422
282Alessandro Giannessi(ITA)0.6400.094-0.007-0.005251-3125
283Julio Cesar Campozano(ECU)0.6400.0390.0250.000202-8123
284Jason Kubler(AUS)0.6400.030-0.001-0.01041513115
285Nicolas Devilder(FRA)0.6390.081-0.0340.002277-812
286Michael Lammer(SUI)0.639-0.0160.004-0.0113415520
287Radu Albot(MDA)0.6380.0170.092-0.007235-5226
288Josh Goodall(GBR)0.636-0.032-0.0040.064252-3627
289Leonardo Kirche(BRA)0.6350.074-0.0440.000213-7622
290Amer Delic(BIH)0.635-0.0340.018-0.0276443544
291Toni Androic(CRO)0.6350.0300.0270.0003233222
292Steven Diez(CAN)0.6340.0370.0040.000261-3125
293Carlos Salamanca(COL)0.6340.037-0.051-0.012262-3117
294Riccardo Ghedin(ITA)0.6340.0220.0420.005269-2521
295James Mcgee(IRL)0.634-0.0060.0590.000291-421
296Michael Linzer(AUT)0.6340.051-0.0020.0003343818
297Gerald Melzer(AUT)0.6330.024-0.0080.000297026
298Lucas Pouille(FRA)0.6320.0240.0160.00041011218
299Stefan Seifert(GER)0.631-0.027-0.022-0.0113192018
300Andrea Collarini(ARG)0.6310.027-0.005-0.018299-124
Surface Factors
RankPlayerNationBase RankClayHardGrassATP RankDiffTournaments
301Jan Minar(CZE)0.631-0.006-0.022-0.01150620512
302Frederik Nielsen(DEN)0.631-0.0120.041-0.00949319112
303Adam Feeney(AUS)0.630-0.0410.028-0.015298-518
304Sanam Singh(IND)0.630-0.0060.031-0.0133161215
305Taro Daniel(JPN)0.6300.0360.0390.000264-4129
306Alejandro Gonzalez(COL)0.6300.1540.0230.016171-13524
307Yuri Schukin(KAZ)0.6290.057-0.037-0.0204661598
308Norbert Gombos(SVK)0.6270.024-0.0020.0003544628
309Arthur De Greef(BEL)0.6260.0590.0300.000263-4626
310Victor Estrella(DOM)0.6260.0610.030-0.0103312112
311Juan Sebastian Cabal(COL)0.6260.082-0.0510.0024811705
312Hiroki Moriya(JPN)0.6260.0020.0260.020184-12825
313Boy Westerhof(NED)0.6260.056-0.0230.000265-4827
314Jeff Dadamo(USA)0.6250.0000.0260.00050919514
315Jonathan Eysseric(FRA)0.6240.037-0.006-0.017287-2828
316Guilherme Clezar(BRA)0.6240.0410.0050.000212-10430
317Olivier Patience(FRA)0.6230.034-0.040-0.02348917211
318Guillermo Olaso(ESP)0.6230.0390.000-0.001308-1023
319Luka Gregorc(SLO)0.623-0.0090.024-0.0237474287
320Alessio di Mauro(ITA)0.6230.045-0.001-0.0253896915
321Matthew Barton(AUS)0.622-0.0020.060-0.010221-10024
322Vincent Millot(FRA)0.6210.0110.028-0.015208-11421
323Aldin Setkic(BIH)0.6210.0290.0070.000258-6529
324Michael McClune(USA)0.620-0.0040.069-0.0113573317
325Artem Smirnov(UKR)0.6200.0700.035-0.02249216718
326Jorge Aguilar(CHI)0.6200.052-0.004-0.013188-13831
327Brydan Klein(AUS)0.619-0.0110.0060.010238-8935
328Florian Reynet(FRA)0.6190.003-0.0020.000273-5528
329Marco Cecchinato(ITA)0.6190.042-0.0020.0003593023
330Edward Corrie(GBR)0.619-0.0090.0010.0033855522
331Gerard Granollers(ESP)0.6180.0670.0170.000302-2928
332Daniele Giorgini(ITA)0.6180.041-0.0280.00051017817
333Sandro Ehrat(SUI)0.6180.0110.0040.0003471425
334Dino Marcan(CRO)0.6180.047-0.0140.0243683427
335Charles-Antoine Brezac(FRA)0.617-0.005-0.0050.01950216716
336Nikola Ciric(SRB)0.6160.079-0.017-0.0143562017
337Moritz Baumann(GER)0.6150.024-0.0130.0003996224
338Richard Bloomfield(GBR)0.614-0.014-0.0240.00954020216
339Hans Podlipnik-Castillo(CHI)0.6130.052-0.0200.000240-9933
340Yannik Reuter(BEL)0.6130.0010.0760.000320-2027
341Germain Gigounon(BEL)0.6130.0350.0190.0004197823
342Tsung-Hua Yang(TPE)0.6120.0390.038-0.017246-9625
343Andrea Arnaboldi(ITA)0.6120.021-0.012-0.0013531028
344Henri Laaksonen(SUI)0.6120.0450.0110.000283-6122
345Jose Checa-Calvo(ESP)0.6110.048-0.008-0.008286-5926
346Peter Torebko(GER)0.6100.038-0.0150.023281-6521
347Luke Saville(AUS)0.610-0.0120.003-0.003340-721
348Alexander Kudryavtsev(RUS)0.6100.0150.047-0.01950715913
349Christian Harrison(USA)0.608-0.008-0.003-0.0053924318
350Alexander Lobkov(RUS)0.6080.0390.0320.000292-5826
Surface Factors
RankPlayerNationBase RankClayHardGrassATP RankDiffTournaments
351Alexandre Sidorenko(FRA)0.607-0.008-0.004-0.00558923820
352Dzmitry Zhyrmont(BLR)0.6070.0150.0150.000279-7320
353Riccardo Bellotti(ITA)0.6070.0520.0230.000307-4621
354Philipp Oswald(AUT)0.6070.0010.006-0.0184317721
355Eric Quigley(USA)0.6070.0030.004-0.00256220714
356Marek Michalicka(CZE)0.6070.034-0.0050.0003873125
357Denis Gremelmayr(GER)0.6070.0020.0660.0007363796
358Axel Michon(FRA)0.6060.018-0.0340.000318-4030
359Laurent Recouderc(FRA)0.6060.015-0.0270.00046110210
360Jordi Samper-Montana(ESP)0.606-0.0110.0490.000300-6033
361Jose Statham(NZL)0.605-0.006-0.008-0.013290-7126
362Leandro Migani(ARG)0.6050.029-0.0110.000276-8625
363Devin Britton(USA)0.605-0.032-0.0070.0024044120
364Benjamin Mitchell(AUS)0.604-0.0280.034-0.0133751126
365Julio Silva(BRA)0.6040.033-0.044-0.0234134816
366Blake Strode(USA)0.6040.009-0.013-0.0204711057
367Daniel Cox(GBR)0.603-0.0270.0520.00560323610
368Pierre-Ludovic Duclos(CAN)0.602-0.0040.017-0.0036853178
369Marton Fucsovics(HUN)0.6020.0210.0070.0233841520
370Marcel Felder(URU)0.6020.0040.0210.01152815815
371Laurynas Grigelis(LTU)0.6020.0400.022-0.0074568521
372Matt Reid(AUS)0.6020.0140.049-0.011230-14227
373Adrien Bossel(SUI)0.6010.011-0.0400.0024073422
374Mathieu Rodrigues(FRA)0.601-0.004-0.003-0.00248511119
375Laurent Rochette(FRA)0.6000.0820.0000.008271-10415
376Benjamin Balleret(MON)0.6000.0530.0050.00258520916
377Jules Marie(FRA)0.6000.0180.0310.000289-8824
378Andres Molteni(ARG)0.6000.012-0.023-0.012360-1825
379Carsten Ball(AUS)0.5990.0080.004-0.00262624710
380Chase Buchanan(USA)0.5990.007-0.017-0.018351-2918
381James Lemke(AUS)0.5990.0420.0190.0254476616
382Alex Bolt(AUS)0.598-0.0170.0100.023337-4528
383Petru-Alexandru Luncanu(ROU)0.598-0.008-0.022-0.0104254217
384Ivan Bjelica(SRB)0.5980.061-0.0130.000338-4624
385Sherif Sabry(EGY)0.5970.0310.0060.0004678216
386Juan-Pablo Amado(ARG)0.5960.011-0.020-0.014342-4421
387Marcelo Demoliner(BRA)0.5960.0680.0130.000253-13423
388Michael Ryderstedt(SWE)0.595-0.008-0.024-0.01553414614
389Sebastian Decoud(ARG)0.5940.027-0.012-0.0074698019
390Evgeny Kirillov(RUS)0.594-0.040-0.009-0.007383-713
391Timo Nieminen(FIN)0.594-0.044-0.023-0.010394324
392Marc Rath(AUT)0.5930.019-0.0280.0004758317
393Andre Begemann(GER)0.5930.071-0.013-0.00749410115
394Fritz Wolmarans(RSA)0.593-0.0260.0320.002329-6521
395Pablo Galdon(ARG)0.5930.0490.005-0.009362-3324
396Robin Kern(GER)0.592-0.0020.0280.036381-1521
397Kimmer Coppejans(BEL)0.5920.010-0.0040.0056342379
398Guillermo Rivera-Aranguiz(CHI)0.592-0.005-0.0050.000365-3323
399Alexander Ward(GBR)0.592-0.015-0.004-0.0064434420
400Kyle Edmund(GBR)0.5910.019-0.006-0.01354914917
Surface Factors
RankPlayerNationBase RankClayHardGrassATP RankDiffTournaments
401Erik Chvojka(CAN)0.589-0.0540.0280.020278-12322
402Marin Bradaric(CRO)0.5880.0120.0040.000372-3017
403Mikhail Ledovskikh(RUS)0.588-0.0070.0450.0055541516
404Christopher Rungkat(INA)0.588-0.0050.018-0.015248-15622
405Luca Vanni(ITA)0.5870.034-0.0020.000309-9625
406Julien Obry(FRA)0.5870.0070.0170.0004201425
407Nikoloz Basilashvili(GEO)0.5860.042-0.0030.000245-16219
408Vladimir Uzhylovsky(UKR)0.586-0.014-0.0100.00051610824
409Kamil Capkovic(SVK)0.5850.008-0.0150.000346-6325
410Yu Chang(CHN)0.5850.0130.0050.000339-7126
411Nicolas Reissig(AUT)0.5830.036-0.0160.0004362518
412Grzegorz Panfil(POL)0.5830.041-0.013-0.0094513921
413Bjorn Fratangelo(USA)0.5830.0990.0070.0004574427
414Adam Pavlasek(CZE)0.5820.003-0.0110.0004402622
415Miljan Zekic(SRB)0.5820.0390.0010.0004271220
416Mikhail Elgin(RUS)0.5820.0230.0000.008N/AN/AN/A
417Kevin Krawietz(GER)0.5820.044-0.008-0.009350-6726
418Jozef Kovalik(SVK)0.5820.0670.032-0.006335-8324
419Reid Carleton(USA)0.581-0.0160.0000.0005038420
420Oliver Golding(GBR)0.5810.0050.0040.0014684819
421Antoine Benneteau(FRA)0.581-0.010-0.019-0.005401-2024
422Marc Giner(ESP)0.5800.056-0.0120.000304-11830
423Saketh-Sai Myneni(IND)0.580-0.0230.0350.000395-2813
424Peter Heller(GER)0.579-0.002-0.0100.0004654126
425Ricardo Hocevar(BRA)0.579-0.0060.0160.005275-15023
426Daniel King-Turner(NZL)0.578-0.012-0.008-0.005376-5014
427Jan Satral(CZE)0.578-0.007-0.0140.00056313615
428Teodor-Dacian Craciun(ROU)0.5780.0140.0000.00067324510
429Neil Pauffley(GBR)0.578-0.031-0.0100.0004542528
430Enrico Burzi(ITA)0.5770.020-0.0210.0004885829
431Michael Venus(NZL)0.577-0.0090.0020.0004441317
432Toshihide Matsui(JPN)0.576-0.014-0.016-0.0124966420
433Suk-Young Jeong(KOR)0.576-0.0120.0340.000295-13819
434Nicholas Monroe(USA)0.576-0.0290.034-0.0218744404
435Vishnu Vardhan(IND)0.576-0.0030.073-0.008345-9015
436Michal Konecny(CZE)0.575-0.0590.0240.027388-4827
437Guillermo Hormazabal(CHI)0.5750.031-0.0380.00054410714
438Andrey Kumantsov(RUS)0.5750.0110.0340.000333-10522
439Marco Crugnola(ITA)0.5730.049-0.0040.02859815914
440Clement Reix(FRA)0.5730.0050.029-0.006358-8220
441Miliaan Niesten(NED)0.5730.0100.0210.0005016016
442Nicolas Meister(USA)0.5720.0160.0220.0005399712
443Jerome Inzerillo(FRA)0.5720.013-0.0010.000416-2723
444Carlos Gomez-Herrera(ESP)0.5720.020-0.0130.000439-520
445Alexey Vatutin(RUS)0.5720.0160.0360.000453826
446Simon Stadler(GER)0.5710.002-0.0110.0239144683
447Patricio Heras(ARG)0.5710.0690.0260.000378-6916
448Juan-Martin Aranguren(ARG)0.571-0.003-0.018-0.0125126414
449Adam Chadaj(POL)0.5710.0000.017-0.0095378820
450Fabiano De Paula(BRA)0.5710.074-0.0020.000254-19624
Surface Factors
RankPlayerNationBase RankClayHardGrassATP RankDiffTournaments
451Morgan Phillips(GBR)0.570-0.0020.000-0.01369224110
452Alexander Slabinsky(GBR)0.5700.0290.0020.0335136121
453Maximilian Neuchrist(AUT)0.569-0.0080.0270.000458519
454Gianluigi Quinzi(ITA)0.5690.008-0.0030.01855610213
455Mathias Bourgue(FRA)0.5690.0170.065-0.01264819317
456Harri Heliovaara(FIN)0.569-0.0020.0080.00359914314
457Joris De Loore(BEL)0.5690.037-0.0160.0205539623
458Fernando Romboli(BRA)0.5690.0440.010-0.009328-13014
459Colin Ebelthite(AUS)0.569-0.0250.031-0.0057462874
460Jose Pereira(BRA)0.5680.0340.0310.000380-8017
461Filip Peliwo(CAN)0.568-0.0170.0330.0195185717
462David Souto(VEN)0.5670.0030.023-0.015326-13624
463Ti Chen(TPE)0.566-0.0320.0160.007220-24335
464Yong-Kyu Lim(KOR)0.566-0.0150.0350.000434-3014
465Nikola Cacic(SRB)0.566-0.0050.0020.0005205524
466Claudio Grassi(ITA)0.5650.0060.050-0.009327-13928
467Theodoros Angelinos(GRE)0.5650.046-0.0190.000445-2223
468Nikolaus Moser(AUT)0.564-0.0290.0570.0005316319
469Artem Sitak(NZL)0.564-0.0010.055-0.0144831416
470Goran Tosic(MNE)0.5640.033-0.0260.000448-2218
471Zhe Li(CHN)0.564-0.0170.0030.000406-6520
472Ivo Klec(SVK)0.564-0.007-0.0030.011379-9317
473Renzo Olivo(ARG)0.5630.127-0.0090.001219-25428
474Gabriel Trujillo-Soler(ESP)0.5630.019-0.033-0.00760413012
475Dane Propoggia(AUS)0.5630.007-0.026-0.005418-5722
476Mate Delic(CRO)0.5620.0080.000-0.0095325626
477Tomislav Brkic(BIH)0.5620.044-0.0010.045459-1821
478Ricardo Rodriguez(VEN)0.5610.0130.0310.000397-8126
479Adrian Sikora(SVK)0.5610.0170.0040.000400-7926
480Jason Jung(USA)0.5610.0030.0100.0005426221
481Victor Baluda(RUS)0.5600.0330.0340.000423-5822
482Nicolas Pastor(ARG)0.5590.034-0.006-0.008430-5215
483Dimitar Kuzmanov(BUL)0.5590.0160.0270.0005587519
484Miguel Gallardo-Valles(MEX)0.558-0.0330.039-0.017396-8820
485Roman Borvanov(MDA)0.5580.0200.040-0.013373-11222
486Cesar Ramirez(MEX)0.558-0.002-0.0260.000476-1018
487Elie Rousset(FRA)0.558-0.006-0.0070.0005051826
488Liang-Chi Huang(TPE)0.5570.0110.029-0.002315-17330
489Maximiliano Estevez(ARG)0.5570.0180.0650.000282-20728
490Vladimir Ivanov(EST)0.5560.008-0.0010.000452-3823
491John Peers(AUS)0.555-0.001-0.021-0.0096711807
492Daniel Smethurst(GBR)0.5550.0060.000-0.012402-9025
493Thiago Monteiro(BRA)0.5550.0260.000-0.003449-4422
494Julien Dubail(BEL)0.554-0.0210.0110.0005818724
495Antonio Comporto(ITA)0.5540.039-0.0200.0008213267
496Marcelo Arevalo(ESA)0.5540.013-0.0070.000377-11925
497Wesley Koolhof(NED)0.554-0.002-0.0120.0005525521
498Marek Semjan(SVK)0.5540.025-0.048-0.008411-8723
499Danilo Petrovic(SRB)0.5540.039-0.0070.000442-5729
500Jeevan Nedunchezhiyan(IND)0.553-0.012-0.036-0.009422-7820
Surface Factors
RankPlayerNationBase RankClayHardGrassATP RankDiffTournaments
501Ante Pavic(CRO)0.553-0.0540.009-0.0075191818
502Joshua Milton(GBR)0.552-0.0180.089-0.013386-11625
503Gianni Mina(FRA)0.552-0.0210.036-0.00868818514
504Dennis Lajola(USA)0.552-0.0190.011-0.00874023612
505Catalin-Ionut Gard(ROU)0.551-0.018-0.0350.00061711214
506Matteo Trevisan(ITA)0.5500.035-0.0210.00111025965
507Roman Jebavy(CZE)0.550-0.011-0.020-0.016438-6928
508Edoardo Eremin(ITA)0.5500.007-0.0150.0005433524
509Tiago Lopes(BRA)0.549-0.014-0.0300.000463-4622
510Gleb Sakharov(FRA)0.549-0.0050.0180.000517716
511Alexandre Folie(BEL)0.5490.046-0.0110.000491-2028
512Michael Quintero(COL)0.5490.029-0.037-0.008417-9525
513Lorenzo Giustino(ITA)0.5490.045-0.0280.000514122
514Matteo Marrai(ITA)0.5490.043-0.0290.000495-1918
515Mohamed Safwat(EGY)0.548-0.0110.0390.000408-10726
516Adam El Mihdawy(USA)0.548-0.006-0.028-0.010352-16422
517Kristijan Mesaros(CRO)0.5470.055-0.0250.00365513816
518Bruno Sant'Anna(BRA)0.5470.0140.011-0.008393-12520
519Denes Lukacs(HUN)0.547-0.0040.0130.0006451265
520Denis Zivkovic(USA)0.546-0.012-0.020-0.007296-22421
521Guillermo Duran(ARG)0.5460.030-0.0130.000484-3719
522Kevin Kim(USA)0.546-0.067-0.046-0.0156241026
523Alexander Bury(BLR)0.5450.031-0.0130.02463611311
524Mao-Xin Gong(CHN)0.545-0.0220.0460.002348-17619
525Filip Horansky(SVK)0.5450.0100.0370.00165212722
526Michael Look(AUS)0.545-0.022-0.013-0.024460-6623
527Daniel Garza(MEX)0.544-0.0190.0570.000429-9827
528Greg Ouellette(USA)0.544-0.0320.031-0.007391-13720
529Simon Cauvard(FRA)0.544-0.0020.0380.000525-424
530Josko Topic(CRO)0.542-0.008-0.018-0.01265612616
531Yannick Jankovits(FRA)0.541-0.011-0.0050.000414-11724
532Nicolas Barrientos(COL)0.5400.028-0.0210.000284-24824
533Andriej Kapas(POL)0.540-0.003-0.0030.0006097618
534Viktor Galovic(ITA)0.540-0.001-0.0100.000336-19827
535Duilio Beretta(PER)0.5390.004-0.0110.000421-11418
536Alexander Sadecky(SUI)0.539-0.0270.025-0.0195703414
537Chris Wettengel(USA)0.538-0.014-0.005-0.00571017313
538Marcus Willis(GBR)0.538-0.0230.0010.00963810016
539Alexandros Jakupovic(GRE)0.538-0.046-0.0620.000529-1017
540Daniel Dutra Da Silva(BRA)0.5380.050-0.035-0.003428-11224
541Milan Pokrajac(CAN)0.5380.0080.0050.0005753418
542Phillip Simmonds(USA)0.5380.0070.023-0.0185551312
543Hugo Nys(FRA)0.537-0.0020.0020.0006066319
544David Perez Sanz(ESP)0.5370.0150.0410.000535-925
545Antal Van Der Duim(NED)0.5370.029-0.0170.007524-2123
546Dennis Bloemke(GER)0.5360.007-0.0040.000101546910
547Stefano Travaglia(ITA)0.5360.1180.0040.000477-7011
548Duje Kekez(CRO)0.5340.0020.0170.0005924426
549Olivier Sajous(HAI)0.534-0.0210.0220.00073919011
550Antoine Escoffier(FRA)0.534-0.017-0.0080.000470-8026
Surface Factors
RankPlayerNationBase RankClayHardGrassATP RankDiffTournaments
551Liam Broady(GBR)0.5340.011-0.016-0.00188333211
552Roberto Marcora(ITA)0.534-0.009-0.0100.000437-11526
553David Rice(GBR)0.533-0.0270.0250.01675720410
554Cristobal Saavedra-Corvalan(CHI)0.5330.026-0.0060.000412-14230
555Siarhei Betau(BEL)0.533-0.030-0.0380.000N/AN/AN/A
556Alexander Lazov(BUL)0.5320.046-0.0240.006487-6927
557Hiroki Kondo(JPN)0.532-0.010-0.0200.037435-12217
558Christian Lindell(SWE)0.5310.009-0.0170.000545-1315
559Jung-Woong Na(KOR)0.5300.0000.0050.0005882920
560Egor Gerasimov(BLR)0.530-0.002-0.0010.000478-8218
561Darian King(BAR)0.5300.0160.0220.000486-7516
562Markus Eriksson(SWE)0.5300.015-0.0220.00066510320
563Pedro Zerbini(BRA)0.5300.0020.0110.000464-9922
564Andrei Daescu(ROU)0.530-0.0290.0000.0009023389
565Patrik Rosenholm(SWE)0.5300.052-0.0210.000374-19124
566Yann Marti(SUI)0.5290.0700.011-0.01592535911
567Andrew Fitzpatrick(GBR)0.5290.0290.000-0.016499-6825
568Yasutaka Uchiyama(JPN)0.528-0.011-0.001-0.014403-16529
569Nicolas Santos(BRA)0.5280.0230.0320.000473-9622
570Joao Pedro Sorgi(BRA)0.5280.0100.0120.000498-7224
571Razvan Sabau(ROU)0.528-0.0180.002-0.0088572869
572Andres Artunedo Martinavarr(ESP)0.527-0.0250.044-0.008572028
573Enrique Lopez-Perez(ESP)0.525-0.0030.0060.000343-23037
574Marko Djokovic(SRB)0.5250.012-0.0040.0006588418
575Maxim Dubarenco(MDA)0.5250.0070.0000.000511-6423
576Andre Miele(BRA)0.524-0.0360.004-0.008455-12121
577Mitchell Krueger(USA)0.524-0.014-0.0080.01978520815
578Jean-Marc Werner(GER)0.5240.021-0.0130.00079121318
579Juan Carlos Saez(CHI)0.5230.051-0.0040.000398-18127
580Sam Barry(IRL)0.523-0.0020.0060.0065911125
581Alexander Rumyantsev(RUS)0.5230.024-0.0010.000565-1620
582Mate Pavic(CRO)0.523-0.0300.0610.024364-21822
583Takanyi Garanganga(ZIM)0.523-0.0180.026-0.018426-15724
584Karim-Mohamed Maamoun(EGY)0.5220.003-0.0070.0006355110
585Denis Matsukevitch(RUS)0.522-0.048-0.0440.008579-618
586Chu-Huan Yi(TPE)0.5210.022-0.032-0.0146274113
587Filip Veger(CRO)0.520-0.015-0.0160.00071412722
588Federico Gaio(ITA)0.519-0.003-0.0040.000536-5218
589Mikhail Biryukov(RUS)0.519-0.009-0.012-0.0076142519
590Thales Turini(BRA)0.5170.0290.0040.000441-14926
591Junn Mitsuhashi(JPN)0.5170.0340.037-0.01259327
592Piotr Gadomski(POL)0.5160.053-0.0160.0006667422
593Lewis Burton(GBR)0.515-0.0150.012-0.01771512228
594Sarvar Ikramov(UZB)0.5150.013-0.0110.000559-3521
595Emilien Firmin(FRA)0.5150.000-0.013-0.01072513017
596Sekou Bangoura(USA)0.513-0.004-0.012-0.003571-2525
597Joshua Zavala(USA)0.5110.0100.0060.00072112413
598Vladimir Obradovic(SRB)0.511-0.019-0.043-0.01871211415
599Tristan-Samuel Weissborn(AUT)0.511-0.004-0.0180.0006515221
600Michal Schmid(CZE)0.510-0.005-0.0060.000479-12126
Surface Factors
RankPlayerNationBase RankClayHardGrassATP RankDiffTournaments
601Mikhail Fufygin(RUS)0.5100.006-0.0110.0006424119
602Mislav Hizak(CRO)0.509-0.035-0.0120.00084724515
603David Estruch(ESP)0.508-0.005-0.0150.000597-623
604Sami Reinwein(GER)0.508-0.0040.0140.0006696528
605Ivo Mijic(GER)0.5080.011-0.0250.0006787322
606Davy Sum(FRA)0.5080.0170.0100.000615924
607Juan Vazquez-Valenzuela(ARG)0.5070.014-0.0010.0006413419
608Andrew Whittington(AUS)0.5070.0020.0160.0246322418
609James Marsalek(GBR)0.507-0.022-0.0020.015611225
610Ruan Roelofse(RSA)0.507-0.011-0.006-0.009522-8820
611Tiago Fernandes(BRA)0.5060.0180.014-0.01078617515
612Srirambalaji Narayanaswamy(IND)0.5060.0050.0090.000N/AN/AN/A
613Alexandre Penaud(FRA)0.5050.001-0.0090.000590-2323
614Maverick Banes(AUS)0.5050.0200.0010.0008562428
615Kevin Griekspoor(NED)0.5050.003-0.0130.00072911420
616Fabricio Neis(BRA)0.504-0.002-0.0030.000497-11928
617Ivan Nedelko(RUS)0.5030.018-0.0100.000515-10223
618Dorian Descloix(FRA)0.503-0.009-0.0170.00077515715
619Jaime Pulgar-Garcia(ESP)0.503-0.0100.002-0.01079317420
620Miguel Angel Reyes-Varela(MEX)0.502-0.0240.0990.000538-8226
621Miki Jankovic(SRB)0.5020.008-0.0120.00077615516
622Sasa Stojisavljevic(SRB)0.501-0.016-0.0090.00075313119
623Bastian Trinker(AUT)0.5010.041-0.0270.0006815824
624Mauricio Echazu(PER)0.501-0.003-0.0180.000523-10120
625Hiroyasu Ehara(JPN)0.5000.008-0.0230.0136593419
626Jack Carpenter(GBR)0.499-0.0020.001-0.01873010421
627Shuichi Sekiguchi(JPN)0.498-0.0320.0360.011472-15519
628Tomislav Ternar(SLO)0.498-0.0140.0000.0007279919
629Federico Coria(ARG)0.497-0.0260.0000.000530-9925
630Richard Becker(GER)0.4970.0190.0160.00081518513
631Marcus Daniell(NZL)0.496-0.002-0.0130.0236895829
632Aslan Karatsev(RUS)0.4950.0190.0060.00074211020
633Rudy Coco(FRA)0.494-0.0120.010-0.00579015717
634Jaan-Frederik Brunken(FIN)0.494-0.007-0.014-0.0076471316
635Tristan Lamasine(FRA)0.4940.027-0.0070.0009232889
636Erik Crepaldi(ITA)0.494-0.0070.006-0.003567-6928
637Ji Sung Nam(KOR)0.4940.0870.0370.000474-16324
638Otakar Lucak(CZE)0.493-0.0200.0450.00074310520
639Marvin Netuschil(GER)0.492-0.013-0.0010.00085321424
640Takuto Niki(JPN)0.492-0.008-0.0150.017596-4416
641Marco Viola(ITA)0.490-0.027-0.0140.00090326210
642Juan Ignacio Londero(ARG)0.4900.0020.0050.000490-15224
643Vijayant Malik(IND)0.489-0.016-0.0040.000541-10218
644Giacomo Oradini(ITA)0.489-0.004-0.0150.0007046024
645Ivan Arenas-Gualda(ESP)0.487-0.0280.0150.0006682328
646Kento Takeuchi(JPN)0.4870.012-0.0010.000446-20025
647Kittipong Wachiramanowong(THA)0.487-0.017-0.001-0.019649218
648Claudio Fortuna(ITA)0.4860.0030.0080.0006803224
649Arata Onozawa(JPN)0.4860.003-0.0190.000619-3020
650Alessandro Bega(ITA)0.486-0.012-0.0300.000450-20032
Surface Factors
RankPlayerNationBase RankClayHardGrassATP RankDiffTournaments
651Alessandro Petrone(ITA)0.4850.004-0.0010.000654315
652Christopher Diaz-Figueroa(GUA)0.485-0.0220.0370.000500-15226
653Abdullah Maqdas(KUW)0.484-0.0220.0080.021504-14924
654Juan Sebastian Gomez(COL)0.4840.016-0.006-0.0086863210
655Carlos Eduardo Severino(BRA)0.483-0.005-0.0010.000631-2417
656Arsenije Zlatanovic(SRB)0.483-0.007-0.0140.000616-4025
657Sean Thornley(GBR)0.482-0.016-0.013-0.005102636914
658Denis Yevseyev(KAZ)0.482-0.0020.0130.000586-7218
659Vadim Alekseenko(UKR)0.480-0.0070.011-0.0077286920
660Mark Verryth(AUS)0.480-0.005-0.016-0.00282316311
661Stanislav Poplavskyy(UKR)0.4800.002-0.0270.0007266517
662Ivan Endara(ECU)0.480-0.011-0.0250.00010123509
663Gabriel Alejandro Hidalgo(ARG)0.4800.0600.0000.000576-8724
664Andrei Ciumac(MDA)0.480-0.004-0.0060.000577-8737
665Roberto Ortega-Olmedo(ESP)0.480-0.0090.0050.000661-425
666N. Vijay Sundar Prashanth(IND)0.478-0.023-0.0380.000564-10218
667Riccardo Sinicropi(ITA)0.477-0.0220.0240.000623-4432
668Karan Rastogi(IND)0.4770.0070.001-0.0148001326
669Giulio Torroni(ITA)0.4760.010-0.0080.0007316222
670Wilson Leite(BRA)0.4760.0310.0130.0006821228
671Miguel Angel Lopez Jaen(ESP)0.475-0.042-0.015-0.014633-3824
672Richard Muzaev(RUS)0.474-0.007-0.0070.000637-3516
673Stanislav Vovk(RUS)0.4740.021-0.0120.000587-8620
674Mauricio Perez Mota(ARG)0.4740.0280.0000.000610-6422
675Sergio Galdos(PER)0.474-0.002-0.0130.000600-7524
676Robin Olin(SWE)0.4740.003-0.0080.000607-6920
677Sebastien Boltz(FRA)0.473-0.012-0.0150.000660-1725
678Eduardo Dischinger(BRA)0.4730.0200.0120.000566-11223
679Ranjeet Virali-Murugesan(IND)0.473-0.0290.0210.000526-15319
680Richard Waite(GER)0.473-0.0030.011-0.00683015017
681Kevin Botti(FRA)0.4720.012-0.0010.0007547322
682Carlos Poch-Gradin(ESP)0.471-0.048-0.032-0.01188720515
683Lukas Jastraunig(AUT)0.4700.0180.0020.0007456223
684Juho Paukku(FIN)0.469-0.071-0.0170.00011804969
685George Morgan(GBR)0.469-0.022-0.016-0.0017799422
686Yuichi Ito(JPN)0.467-0.0020.019-0.00986618016
687Filippo Leonardi(ITA)0.4660.004-0.0180.0007324525
688Valentin Florez(ARG)0.466-0.025-0.0190.00084816015
689Riccardo Maiga(SUI)0.466-0.0080.0000.0007889916
690Chris Letcher(AUS)0.464-0.016-0.017-0.001569-12124
691Matthew Short(GBR)0.464-0.009-0.0050.0097596821
692Juan Pablo Ortiz(ARG)0.464-0.035-0.0010.0007707820
693Juan-Sebastian Vivanco(ECU)0.464-0.001-0.0040.0007717822
694Nicolas Gustavo Kauer(CHI)0.463-0.006-0.0050.000582-11226
695Francois-Arthur Vibert(FRA)0.462-0.0040.0010.000622-7331
696Facundo Mena(ARG)0.4610.010-0.0050.000547-14925
697Patrik Brydolf(SWE)0.4610.031-0.018-0.022612-8526
698Joaquin-Jesus Monteferrario(ARG)0.4610.0050.0270.000560-13825
699Gonzalo Lama(CHI)0.4600.0730.0080.000662-3726
700Woong-Sun Jun(KOR)0.460-0.002-0.013-0.01292922913
Surface Factors
RankPlayerNationBase RankClayHardGrassATP RankDiffTournaments
701Diego Matos(BRA)0.460-0.0550.0010.0007616025
702Jiri Skoloudik(CZE)0.459-0.040-0.0160.00087016821
703Joss Espasandin(SUI)0.4590.001-0.008-0.008679-2422
704Daniel Yoo(KOR)0.459-0.014-0.013-0.009102031612
705Giammarco Micolani(ITA)0.458-0.0060.0220.0007443922
706Hugo Dellien(BOL)0.4570.012-0.0030.000664-4219
707Ricardo Urzua-Rivera(CHI)0.457-0.0680.0080.005103232519
708Oriol Roca Batalla(ESP)0.456-0.013-0.001-0.0097968825
709Richard Gabb(GBR)0.4560.000-0.020-0.0037554628
710Bumpei Sato(JPN)0.454-0.010-0.0030.00285214217
711Federico Zeballos(BOL)0.4540.000-0.0140.000629-8216
712Augusto Laranja(BRA)0.453-0.0230.0160.000621-9122
713Mauricio Astorga(MEX)0.453-0.001-0.0240.000694-1919
714Jakub Lustyk(CZE)0.452-0.0140.0150.00083412019
715Sergei Krotiouk(RUS)0.451-0.033-0.044-0.007696-1922
716Federico Torresi(ITA)0.451-0.026-0.029-0.004113041413
717Bowen Ouyang(CHN)0.450-0.003-0.008-0.0067988129
718Marco Bortolotti(ITA)0.449-0.013-0.0070.00089017221
719Andrei Vasilevski(BLR)0.449-0.011-0.0130.000650-6920
720Felipe Rios(CHI)0.4470.010-0.0100.0007896917
721Constantin Belot(FRA)0.447-0.011-0.0090.00083711621
722Luis David Martinez(VEN)0.447-0.0210.0060.000620-10222
723Tuna Altuna(TUR)0.447-0.023-0.015-0.00296924624
724Francesco Picco(ITA)0.4460.002-0.0080.0007674317
725Chuhan Wang(CHN)0.446-0.005-0.0220.000695-3021
726Toby Martin(GBR)0.445-0.0050.004-0.01289416826
727Lucas Renard(SWE)0.4440.0040.0000.000677-5021
728Ricardo Siggia(BRA)0.443-0.0350.0150.000705-2324
729Luis Diaz-Barriga(MEX)0.4430.0020.0210.000684-457
730Jordan Cox(USA)0.441-0.018-0.021-0.01011664367
731Nicolas Rosenzweig(FRA)0.4390.013-0.010-0.0097804923
732Martin Cuevas(URU)0.437-0.047-0.0070.000138064815
733Hsin-Han Lee(TPE)0.436-0.006-0.031-0.0058411086
734Martin Rios-Benitez(ARG)0.436-0.0530.0000.0008168213
735Mikhail Vasiliev(RUS)0.436-0.014-0.0120.000653-8230
736Matias Sborowitz(CHI)0.428-0.006-0.0040.000733-327
737Caio Silva(BRA)0.428-0.006-0.0310.0007693220
738Rafael Mazon-Hernandez(ESP)0.423-0.018-0.0160.000108434620
739Alexandre Schnitman(BRA)0.422-0.011-0.0020.000703-3623
740Tomas Buchhass(ARG)0.421-0.009-0.0100.0008369620
741Ramkumar Ramanathan(IND)0.420-0.013-0.0020.0007955421
742Robert Coman(ROU)0.417-0.004-0.0140.000102428213
743Maciek Sykut(USA)0.417-0.022-0.0050.00013165736
744Francesco Borgo(ITA)0.416-0.015-0.0110.000108634222
745Ryan Agar(AUS)0.415-0.0070.0230.00689314826
746Jorge Montero(CHI)0.4130.010-0.0120.0008086226
747Felipe Mantilla(COL)0.413-0.030-0.0030.000113538814
748Alessandro Colella(ITA)0.411-0.008-0.0140.010107232414
749Ryusei Makiguchi(JPN)0.408-0.030-0.0150.000667-8222
750Mark Vervoort(NED)0.407-0.020-0.0120.0008207024
Surface Factors
RankPlayerNationBase RankClayHardGrassATP RankDiffTournaments
751Francesco Vilardo(ITA)0.4070.006-0.024-0.00193818727
752Gustavo Guerses(BRA)0.4030.005-0.0040.000760823
753Manuel Sanchez(MEX)0.401-0.025-0.030-0.011126651318
754Christopher Racz(USA)0.401-0.006-0.0030.00088913516
755Marlon Oliveira(BRA)0.398-0.014-0.0040.000108533020
756Filipe Brandao(BRA)0.3940.004-0.0120.00089213623
757James Feaver(GBR)0.392-0.011-0.004-0.004125950211
758Marko Danis(SVK)0.391-0.020-0.0080.00087211425
759Emanuele Molina(ITA)0.388-0.020-0.0100.00099623720
760Gustavo Sterin(ARG)0.388-0.026-0.0020.00099323317
761Marvin Barker(NZL)0.381-0.016-0.015-0.009103127019
762Luca Margaroli(SUI)0.377-0.008-0.0080.00096420217
763Andres Ceppo(ARG)0.353-0.028-0.0030.000114338024
764Goncalo Pereira(POR)0.346-0.018-0.0170.000156980515
765Vitali Reshetnikov(RUS)0.345-0.021-0.0120.000103326820
Viewing all 4373 articles
Browse latest View live